Lumbee vs Guatemalan Poverty
COMPARE
Lumbee
Guatemalan
Poverty
Poverty Comparison
Lumbee
Guatemalans
21.9%
POVERTY
0.0/ 100
METRIC RATING
344th/ 347
METRIC RANK
15.3%
POVERTY
0.0/ 100
METRIC RATING
295th/ 347
METRIC RANK
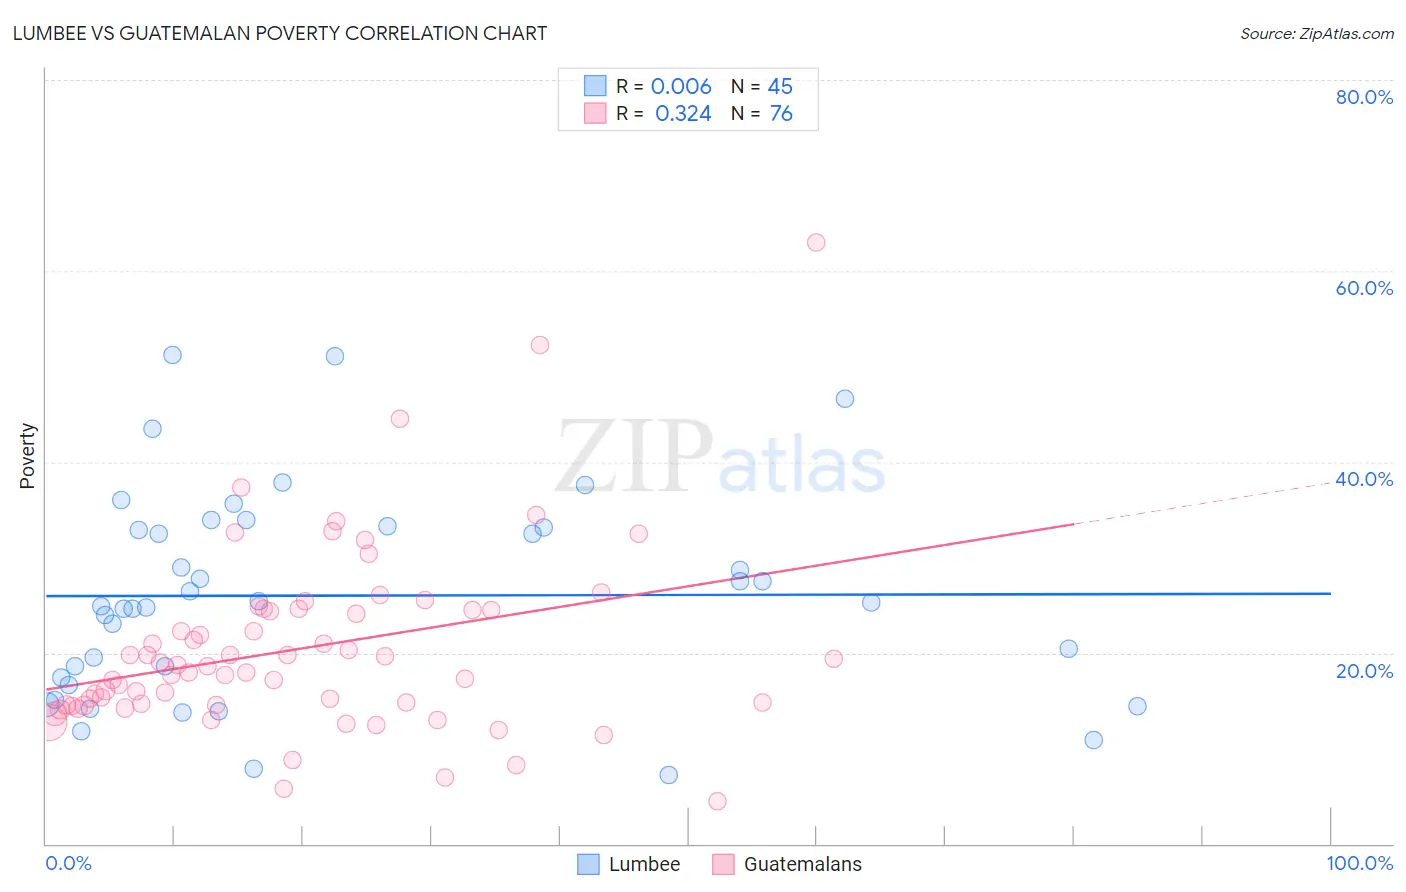
Lumbee vs Guatemalan Poverty Correlation Chart
The statistical analysis conducted on geographies consisting of 92,257,257 people shows no correlation between the proportion of Lumbee and poverty level in the United States with a correlation coefficient (R) of 0.006 and weighted average of 21.9%. Similarly, the statistical analysis conducted on geographies consisting of 409,295,647 people shows a mild positive correlation between the proportion of Guatemalans and poverty level in the United States with a correlation coefficient (R) of 0.324 and weighted average of 15.3%, a difference of 43.6%.
Poverty Correlation Summary
| Measurement | Lumbee | Guatemalan |
| Minimum | 7.2% | 4.4% |
| Maximum | 51.2% | 62.9% |
| Range | 44.0% | 58.5% |
| Mean | 26.0% | 20.4% |
| Median | 25.2% | 18.3% |
| Interquartile 25% (IQ1) | 17.0% | 14.5% |
| Interquartile 75% (IQ3) | 33.2% | 24.5% |
| Interquartile Range (IQR) | 16.2% | 10.0% |
| Standard Deviation (Sample) | 10.8% | 9.7% |
| Standard Deviation (Population) | 10.7% | 9.6% |
Similar Demographics by Poverty
Demographics Similar to Lumbee by Poverty
In terms of poverty, the demographic groups most similar to Lumbee are Pima (21.9%, a difference of 0.26%), Immigrants from Yemen (21.5%, a difference of 1.9%), Hopi (20.8%, a difference of 5.1%), Yup'ik (20.8%, a difference of 5.3%), and Navajo (23.1%, a difference of 5.4%).
| Demographics | Rating | Rank | Poverty |
| Houma | 0.0 /100 | #333 | Tragic 18.4% |
| Apache | 0.0 /100 | #334 | Tragic 18.4% |
| Cheyenne | 0.0 /100 | #335 | Tragic 18.9% |
| Pueblo | 0.0 /100 | #336 | Tragic 19.4% |
| Sioux | 0.0 /100 | #337 | Tragic 19.8% |
| Yuman | 0.0 /100 | #338 | Tragic 20.2% |
| Crow | 0.0 /100 | #339 | Tragic 20.7% |
| Yup'ik | 0.0 /100 | #340 | Tragic 20.8% |
| Hopi | 0.0 /100 | #341 | Tragic 20.8% |
| Immigrants | Yemen | 0.0 /100 | #342 | Tragic 21.5% |
| Pima | 0.0 /100 | #343 | Tragic 21.9% |
| Lumbee | 0.0 /100 | #344 | Tragic 21.9% |
| Navajo | 0.0 /100 | #345 | Tragic 23.1% |
| Puerto Ricans | 0.0 /100 | #346 | Tragic 23.7% |
| Tohono O'odham | 0.0 /100 | #347 | Tragic 24.4% |
Demographics Similar to Guatemalans by Poverty
In terms of poverty, the demographic groups most similar to Guatemalans are Hispanic or Latino (15.3%, a difference of 0.010%), Immigrants from Bangladesh (15.3%, a difference of 0.050%), Immigrants from Senegal (15.3%, a difference of 0.20%), Senegalese (15.3%, a difference of 0.30%), and Blackfeet (15.2%, a difference of 0.42%).
| Demographics | Rating | Rank | Poverty |
| Yaqui | 0.0 /100 | #288 | Tragic 15.1% |
| Immigrants | Belize | 0.0 /100 | #289 | Tragic 15.1% |
| Mexicans | 0.0 /100 | #290 | Tragic 15.1% |
| Immigrants | Cabo Verde | 0.0 /100 | #291 | Tragic 15.1% |
| Indonesians | 0.0 /100 | #292 | Tragic 15.1% |
| Immigrants | Zaire | 0.0 /100 | #293 | Tragic 15.1% |
| Blackfeet | 0.0 /100 | #294 | Tragic 15.2% |
| Guatemalans | 0.0 /100 | #295 | Tragic 15.3% |
| Hispanics or Latinos | 0.0 /100 | #296 | Tragic 15.3% |
| Immigrants | Bangladesh | 0.0 /100 | #297 | Tragic 15.3% |
| Immigrants | Senegal | 0.0 /100 | #298 | Tragic 15.3% |
| Senegalese | 0.0 /100 | #299 | Tragic 15.3% |
| Immigrants | Central America | 0.0 /100 | #300 | Tragic 15.4% |
| Bahamians | 0.0 /100 | #301 | Tragic 15.4% |
| Somalis | 0.0 /100 | #302 | Tragic 15.4% |