Lithuanian vs Immigrants from Korea Bachelor's Degree
COMPARE
Lithuanian
Immigrants from Korea
Bachelor's Degree
Bachelor's Degree Comparison
Lithuanians
Immigrants from Korea
42.2%
BACHELOR'S DEGREE
99.2/ 100
METRIC RATING
85th/ 347
METRIC RANK
47.0%
BACHELOR'S DEGREE
100.0/ 100
METRIC RATING
24th/ 347
METRIC RANK
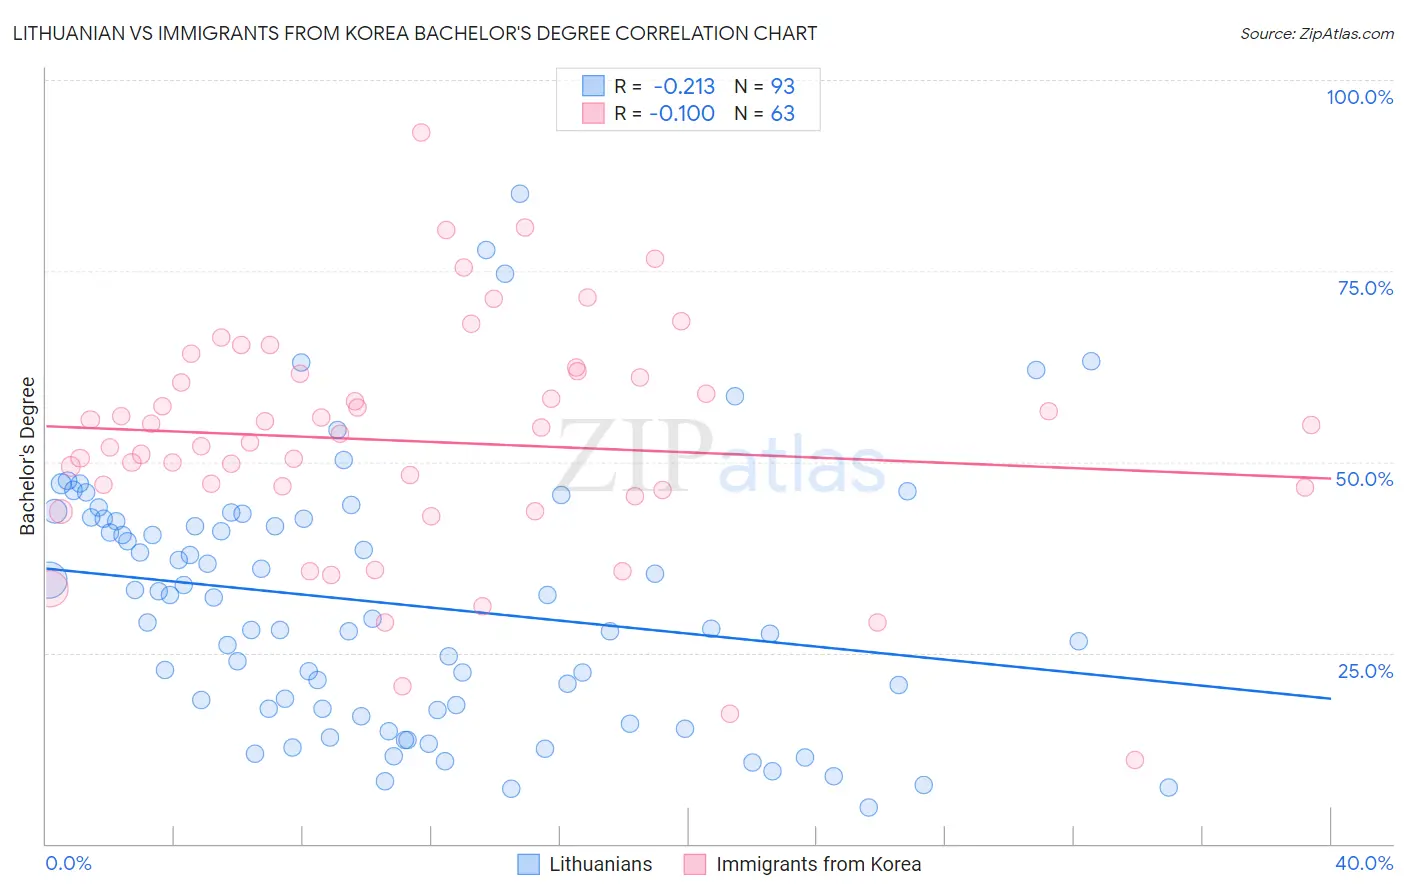
Lithuanian vs Immigrants from Korea Bachelor's Degree Correlation Chart
The statistical analysis conducted on geographies consisting of 421,915,203 people shows a weak negative correlation between the proportion of Lithuanians and percentage of population with at least bachelor's degree education in the United States with a correlation coefficient (R) of -0.213 and weighted average of 42.2%. Similarly, the statistical analysis conducted on geographies consisting of 416,289,272 people shows a slight negative correlation between the proportion of Immigrants from Korea and percentage of population with at least bachelor's degree education in the United States with a correlation coefficient (R) of -0.100 and weighted average of 47.0%, a difference of 11.2%.
Bachelor's Degree Correlation Summary
| Measurement | Lithuanian | Immigrants from Korea |
| Minimum | 4.7% | 10.9% |
| Maximum | 85.2% | 93.1% |
| Range | 80.5% | 82.2% |
| Mean | 31.4% | 52.7% |
| Median | 29.4% | 53.7% |
| Interquartile 25% (IQ1) | 17.6% | 46.3% |
| Interquartile 75% (IQ3) | 42.5% | 61.5% |
| Interquartile Range (IQR) | 25.0% | 15.2% |
| Standard Deviation (Sample) | 16.9% | 15.3% |
| Standard Deviation (Population) | 16.8% | 15.1% |
Similar Demographics by Bachelor's Degree
Demographics Similar to Lithuanians by Bachelor's Degree
In terms of bachelor's degree, the demographic groups most similar to Lithuanians are Immigrants from Western Asia (42.3%, a difference of 0.030%), Armenian (42.3%, a difference of 0.040%), Immigrants from Scotland (42.3%, a difference of 0.070%), Immigrants from Brazil (42.2%, a difference of 0.080%), and Immigrants from Hungary (42.3%, a difference of 0.14%).
| Demographics | Rating | Rank | Bachelor's Degree |
| Immigrants | Ethiopia | 99.4 /100 | #78 | Exceptional 42.5% |
| Immigrants | Lebanon | 99.3 /100 | #79 | Exceptional 42.4% |
| Immigrants | Croatia | 99.2 /100 | #80 | Exceptional 42.3% |
| Immigrants | Hungary | 99.2 /100 | #81 | Exceptional 42.3% |
| Immigrants | Scotland | 99.2 /100 | #82 | Exceptional 42.3% |
| Armenians | 99.2 /100 | #83 | Exceptional 42.3% |
| Immigrants | Western Asia | 99.2 /100 | #84 | Exceptional 42.3% |
| Lithuanians | 99.2 /100 | #85 | Exceptional 42.2% |
| Immigrants | Brazil | 99.2 /100 | #86 | Exceptional 42.2% |
| Carpatho Rusyns | 99.0 /100 | #87 | Exceptional 42.1% |
| Immigrants | Western Europe | 99.0 /100 | #88 | Exceptional 42.0% |
| Greeks | 99.0 /100 | #89 | Exceptional 42.0% |
| Laotians | 98.9 /100 | #90 | Exceptional 42.0% |
| Immigrants | Northern Africa | 98.9 /100 | #91 | Exceptional 41.9% |
| Maltese | 98.8 /100 | #92 | Exceptional 41.9% |
Demographics Similar to Immigrants from Korea by Bachelor's Degree
In terms of bachelor's degree, the demographic groups most similar to Immigrants from Korea are Immigrants from Sweden (47.0%, a difference of 0.040%), Immigrants from Belgium (47.0%, a difference of 0.13%), Burmese (46.9%, a difference of 0.22%), Immigrants from Ireland (47.1%, a difference of 0.33%), and Immigrants from Japan (46.8%, a difference of 0.33%).
| Demographics | Rating | Rank | Bachelor's Degree |
| Eastern Europeans | 100.0 /100 | #17 | Exceptional 47.5% |
| Indians (Asian) | 100.0 /100 | #18 | Exceptional 47.4% |
| Cambodians | 100.0 /100 | #19 | Exceptional 47.2% |
| Immigrants | Switzerland | 100.0 /100 | #20 | Exceptional 47.1% |
| Immigrants | Ireland | 100.0 /100 | #21 | Exceptional 47.1% |
| Immigrants | Belgium | 100.0 /100 | #22 | Exceptional 47.0% |
| Immigrants | Sweden | 100.0 /100 | #23 | Exceptional 47.0% |
| Immigrants | Korea | 100.0 /100 | #24 | Exceptional 47.0% |
| Burmese | 100.0 /100 | #25 | Exceptional 46.9% |
| Immigrants | Japan | 100.0 /100 | #26 | Exceptional 46.8% |
| Immigrants | France | 100.0 /100 | #27 | Exceptional 46.4% |
| Turks | 100.0 /100 | #28 | Exceptional 46.2% |
| Israelis | 100.0 /100 | #29 | Exceptional 46.1% |
| Immigrants | Sri Lanka | 100.0 /100 | #30 | Exceptional 46.1% |
| Latvians | 100.0 /100 | #31 | Exceptional 46.1% |