Latvian vs French Canadian Single Female Poverty
COMPARE
Latvian
French Canadian
Single Female Poverty
Single Female Poverty Comparison
Latvians
French Canadians
19.0%
SINGLE FEMALE POVERTY
99.8/ 100
METRIC RATING
47th/ 347
METRIC RANK
22.2%
SINGLE FEMALE POVERTY
2.8/ 100
METRIC RATING
238th/ 347
METRIC RANK
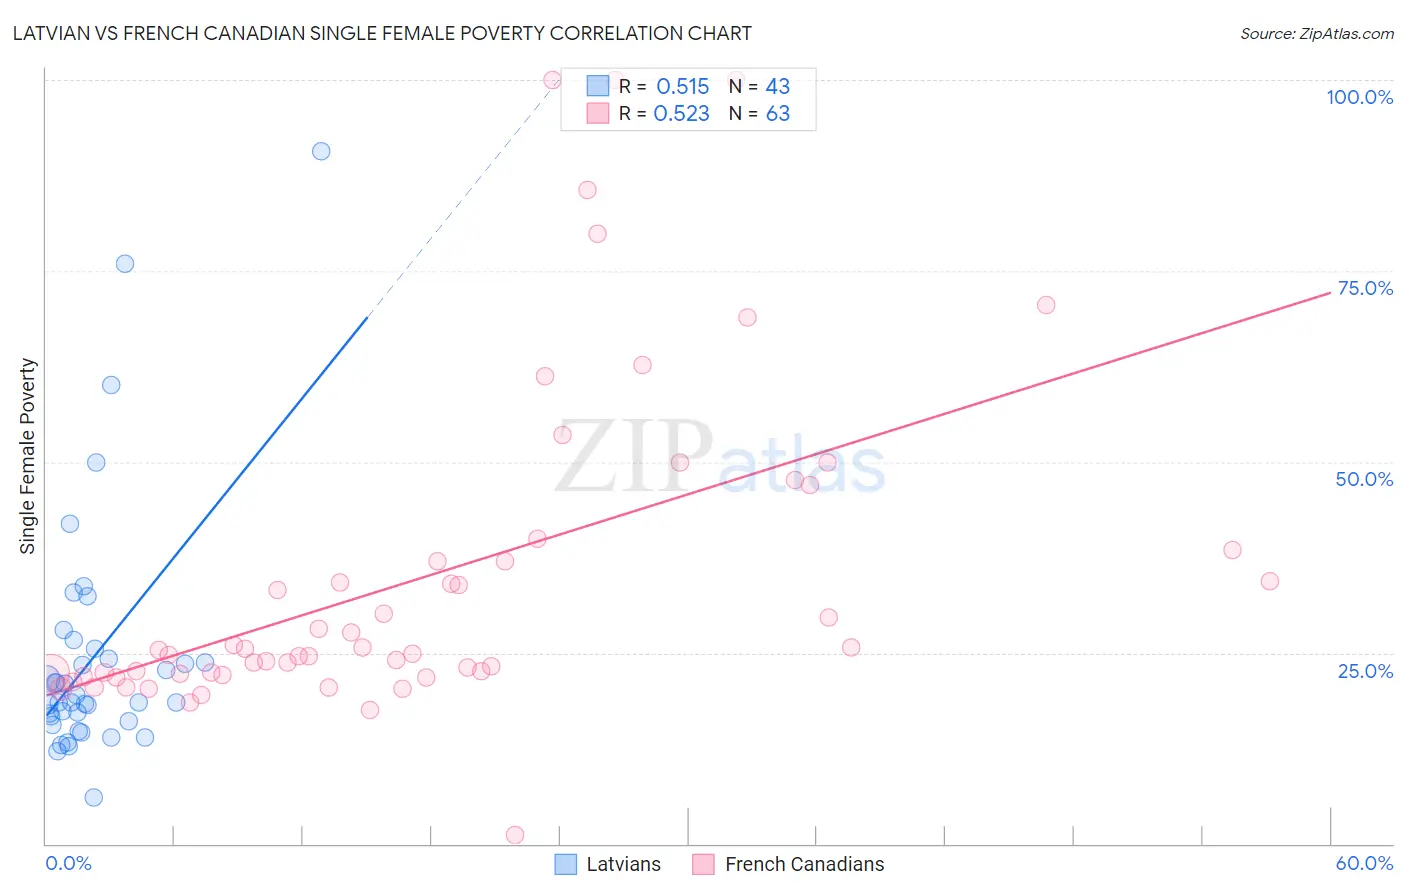
Latvian vs French Canadian Single Female Poverty Correlation Chart
The statistical analysis conducted on geographies consisting of 217,777,893 people shows a substantial positive correlation between the proportion of Latvians and poverty level among single females in the United States with a correlation coefficient (R) of 0.515 and weighted average of 19.0%. Similarly, the statistical analysis conducted on geographies consisting of 489,180,966 people shows a substantial positive correlation between the proportion of French Canadians and poverty level among single females in the United States with a correlation coefficient (R) of 0.523 and weighted average of 22.2%, a difference of 16.8%.
Single Female Poverty Correlation Summary
| Measurement | Latvian | French Canadian |
| Minimum | 6.0% | 1.1% |
| Maximum | 90.7% | 100.0% |
| Range | 84.7% | 98.9% |
| Mean | 24.7% | 35.0% |
| Median | 18.5% | 25.4% |
| Interquartile 25% (IQ1) | 16.0% | 22.3% |
| Interquartile 75% (IQ3) | 25.6% | 38.4% |
| Interquartile Range (IQR) | 9.5% | 16.1% |
| Standard Deviation (Sample) | 16.6% | 21.7% |
| Standard Deviation (Population) | 16.4% | 21.5% |
Similar Demographics by Single Female Poverty
Demographics Similar to Latvians by Single Female Poverty
In terms of single female poverty, the demographic groups most similar to Latvians are Macedonian (18.9%, a difference of 0.19%), Immigrants from Argentina (19.0%, a difference of 0.28%), Immigrants from Czechoslovakia (19.0%, a difference of 0.29%), Immigrants from Eastern Europe (19.0%, a difference of 0.33%), and Immigrants from Indonesia (18.9%, a difference of 0.35%).
| Demographics | Rating | Rank | Single Female Poverty |
| Okinawans | 99.9 /100 | #40 | Exceptional 18.8% |
| Immigrants | Serbia | 99.9 /100 | #41 | Exceptional 18.8% |
| Jordanians | 99.9 /100 | #42 | Exceptional 18.8% |
| Immigrants | Romania | 99.9 /100 | #43 | Exceptional 18.8% |
| Immigrants | Croatia | 99.9 /100 | #44 | Exceptional 18.9% |
| Immigrants | Indonesia | 99.8 /100 | #45 | Exceptional 18.9% |
| Macedonians | 99.8 /100 | #46 | Exceptional 18.9% |
| Latvians | 99.8 /100 | #47 | Exceptional 19.0% |
| Immigrants | Argentina | 99.8 /100 | #48 | Exceptional 19.0% |
| Immigrants | Czechoslovakia | 99.8 /100 | #49 | Exceptional 19.0% |
| Immigrants | Eastern Europe | 99.8 /100 | #50 | Exceptional 19.0% |
| Immigrants | Italy | 99.8 /100 | #51 | Exceptional 19.0% |
| Egyptians | 99.7 /100 | #52 | Exceptional 19.1% |
| Tsimshian | 99.7 /100 | #53 | Exceptional 19.1% |
| Argentineans | 99.7 /100 | #54 | Exceptional 19.1% |
Demographics Similar to French Canadians by Single Female Poverty
In terms of single female poverty, the demographic groups most similar to French Canadians are Malaysian (22.2%, a difference of 0.0%), French (22.2%, a difference of 0.27%), Cape Verdean (22.3%, a difference of 0.41%), Bermudan (22.3%, a difference of 0.48%), and Vietnamese (22.0%, a difference of 0.55%).
| Demographics | Rating | Rank | Single Female Poverty |
| Welsh | 5.0 /100 | #231 | Tragic 22.0% |
| Immigrants | Thailand | 5.0 /100 | #232 | Tragic 22.0% |
| Spaniards | 4.7 /100 | #233 | Tragic 22.0% |
| Spanish | 4.7 /100 | #234 | Tragic 22.0% |
| Dutch | 4.6 /100 | #235 | Tragic 22.0% |
| Immigrants | Ecuador | 4.2 /100 | #236 | Tragic 22.0% |
| Vietnamese | 4.0 /100 | #237 | Tragic 22.0% |
| French Canadians | 2.8 /100 | #238 | Tragic 22.2% |
| Malaysians | 2.8 /100 | #239 | Tragic 22.2% |
| French | 2.3 /100 | #240 | Tragic 22.2% |
| Cape Verdeans | 2.1 /100 | #241 | Tragic 22.3% |
| Bermudans | 2.0 /100 | #242 | Tragic 22.3% |
| West Indians | 1.9 /100 | #243 | Tragic 22.3% |
| Immigrants | Middle Africa | 1.9 /100 | #244 | Tragic 22.3% |
| Immigrants | Bangladesh | 1.8 /100 | #245 | Tragic 22.3% |