Latvian vs French Canadian Unemployment Among Ages 65 to 74 years
COMPARE
Latvian
French Canadian
Unemployment Among Ages 65 to 74 years
Unemployment Among Ages 65 to 74 years Comparison
Latvians
French Canadians
5.1%
UNEMPLOYMENT AMONG AGES 65 TO 74 YEARS
99.2/ 100
METRIC RATING
68th/ 347
METRIC RANK
5.6%
UNEMPLOYMENT AMONG AGES 65 TO 74 YEARS
0.2/ 100
METRIC RATING
266th/ 347
METRIC RANK
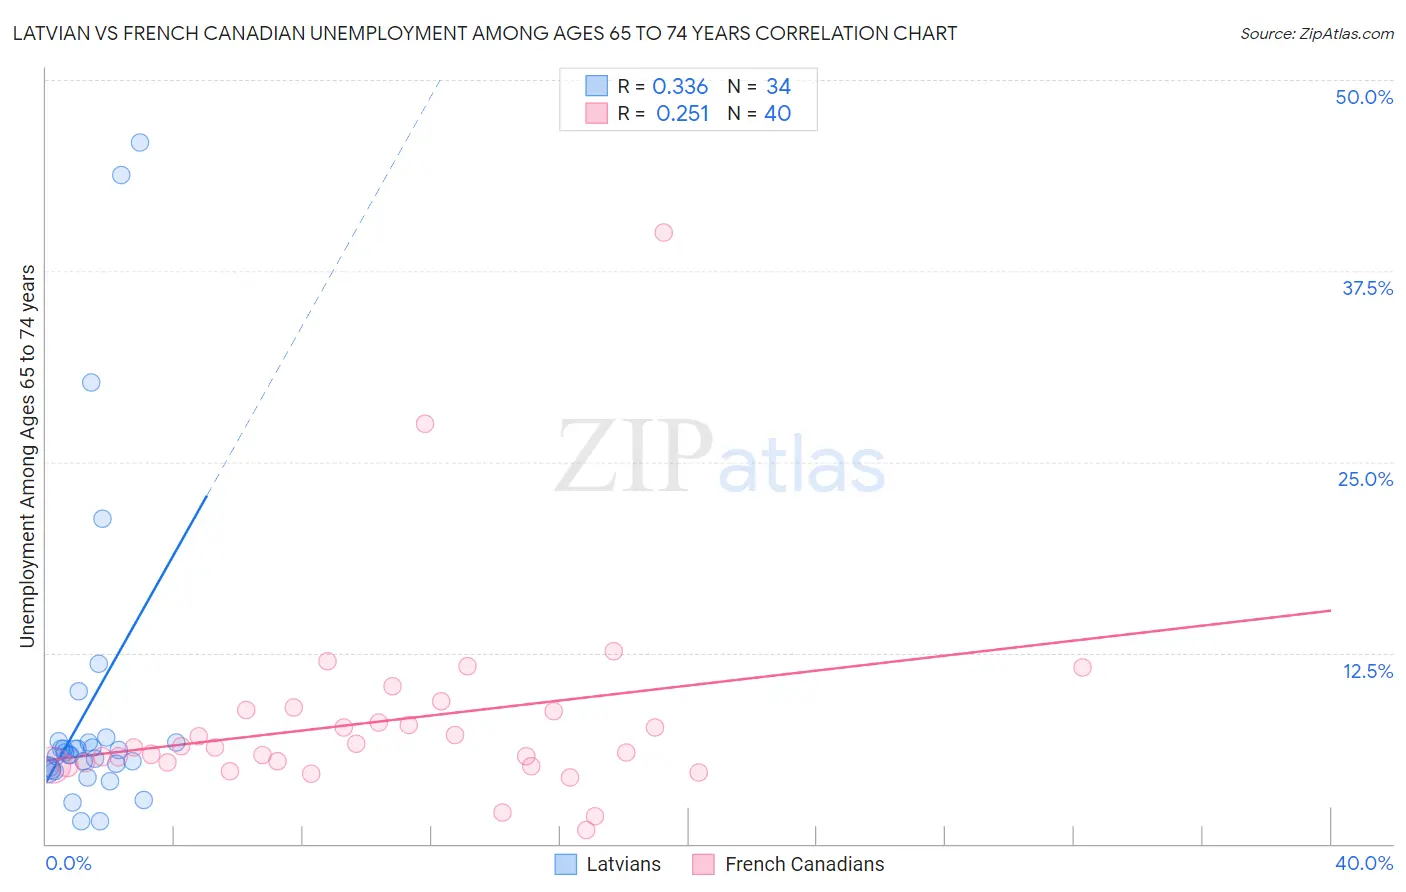
Latvian vs French Canadian Unemployment Among Ages 65 to 74 years Correlation Chart
The statistical analysis conducted on geographies consisting of 203,955,753 people shows a mild positive correlation between the proportion of Latvians and unemployment rate among population between the ages 65 and 74 in the United States with a correlation coefficient (R) of 0.336 and weighted average of 5.1%. Similarly, the statistical analysis conducted on geographies consisting of 412,409,356 people shows a weak positive correlation between the proportion of French Canadians and unemployment rate among population between the ages 65 and 74 in the United States with a correlation coefficient (R) of 0.251 and weighted average of 5.6%, a difference of 9.7%.
Unemployment Among Ages 65 to 74 years Correlation Summary
| Measurement | Latvian | French Canadian |
| Minimum | 1.5% | 0.90% |
| Maximum | 45.9% | 40.0% |
| Range | 44.4% | 39.1% |
| Mean | 9.1% | 8.0% |
| Median | 5.9% | 6.3% |
| Interquartile 25% (IQ1) | 4.8% | 5.2% |
| Interquartile 75% (IQ3) | 6.6% | 8.7% |
| Interquartile Range (IQR) | 1.8% | 3.4% |
| Standard Deviation (Sample) | 10.5% | 6.7% |
| Standard Deviation (Population) | 10.4% | 6.6% |
Similar Demographics by Unemployment Among Ages 65 to 74 years
Demographics Similar to Latvians by Unemployment Among Ages 65 to 74 years
In terms of unemployment among ages 65 to 74 years, the demographic groups most similar to Latvians are Swiss (5.1%, a difference of 0.010%), Iroquois (5.1%, a difference of 0.060%), Scandinavian (5.2%, a difference of 0.070%), Immigrants from Japan (5.2%, a difference of 0.080%), and Bolivian (5.1%, a difference of 0.090%).
| Demographics | Rating | Rank | Unemployment Among Ages 65 to 74 years |
| Immigrants | Taiwan | 99.4 /100 | #61 | Exceptional 5.1% |
| Nicaraguans | 99.4 /100 | #62 | Exceptional 5.1% |
| Kiowa | 99.3 /100 | #63 | Exceptional 5.1% |
| Immigrants | Moldova | 99.3 /100 | #64 | Exceptional 5.1% |
| Bolivians | 99.3 /100 | #65 | Exceptional 5.1% |
| Iroquois | 99.3 /100 | #66 | Exceptional 5.1% |
| Swiss | 99.2 /100 | #67 | Exceptional 5.1% |
| Latvians | 99.2 /100 | #68 | Exceptional 5.1% |
| Scandinavians | 99.1 /100 | #69 | Exceptional 5.2% |
| Immigrants | Japan | 99.1 /100 | #70 | Exceptional 5.2% |
| Scotch-Irish | 99.0 /100 | #71 | Exceptional 5.2% |
| Immigrants | Oceania | 99.0 /100 | #72 | Exceptional 5.2% |
| Filipinos | 99.0 /100 | #73 | Exceptional 5.2% |
| Afghans | 99.0 /100 | #74 | Exceptional 5.2% |
| Okinawans | 99.0 /100 | #75 | Exceptional 5.2% |
Demographics Similar to French Canadians by Unemployment Among Ages 65 to 74 years
In terms of unemployment among ages 65 to 74 years, the demographic groups most similar to French Canadians are Guyanese (5.6%, a difference of 0.010%), Jamaican (5.6%, a difference of 0.040%), Hawaiian (5.7%, a difference of 0.050%), Pueblo (5.6%, a difference of 0.080%), and Immigrants from Jamaica (5.6%, a difference of 0.090%).
| Demographics | Rating | Rank | Unemployment Among Ages 65 to 74 years |
| Sierra Leoneans | 0.2 /100 | #259 | Tragic 5.6% |
| Immigrants | Barbados | 0.2 /100 | #260 | Tragic 5.6% |
| South Americans | 0.2 /100 | #261 | Tragic 5.6% |
| Immigrants | St. Vincent and the Grenadines | 0.2 /100 | #262 | Tragic 5.6% |
| Immigrants | Jamaica | 0.2 /100 | #263 | Tragic 5.6% |
| Pueblo | 0.2 /100 | #264 | Tragic 5.6% |
| Jamaicans | 0.2 /100 | #265 | Tragic 5.6% |
| French Canadians | 0.2 /100 | #266 | Tragic 5.6% |
| Guyanese | 0.2 /100 | #267 | Tragic 5.6% |
| Hawaiians | 0.2 /100 | #268 | Tragic 5.7% |
| Immigrants | Colombia | 0.1 /100 | #269 | Tragic 5.7% |
| Immigrants | Nigeria | 0.1 /100 | #270 | Tragic 5.7% |
| Belizeans | 0.1 /100 | #271 | Tragic 5.7% |
| Yaqui | 0.1 /100 | #272 | Tragic 5.7% |
| Bahamians | 0.1 /100 | #273 | Tragic 5.7% |