Latvian vs Carpatho Rusyn Single Female Poverty
COMPARE
Latvian
Carpatho Rusyn
Single Female Poverty
Single Female Poverty Comparison
Latvians
Carpatho Rusyns
19.0%
SINGLE FEMALE POVERTY
99.8/ 100
METRIC RATING
47th/ 347
METRIC RANK
20.0%
SINGLE FEMALE POVERTY
96.1/ 100
METRIC RATING
111th/ 347
METRIC RANK
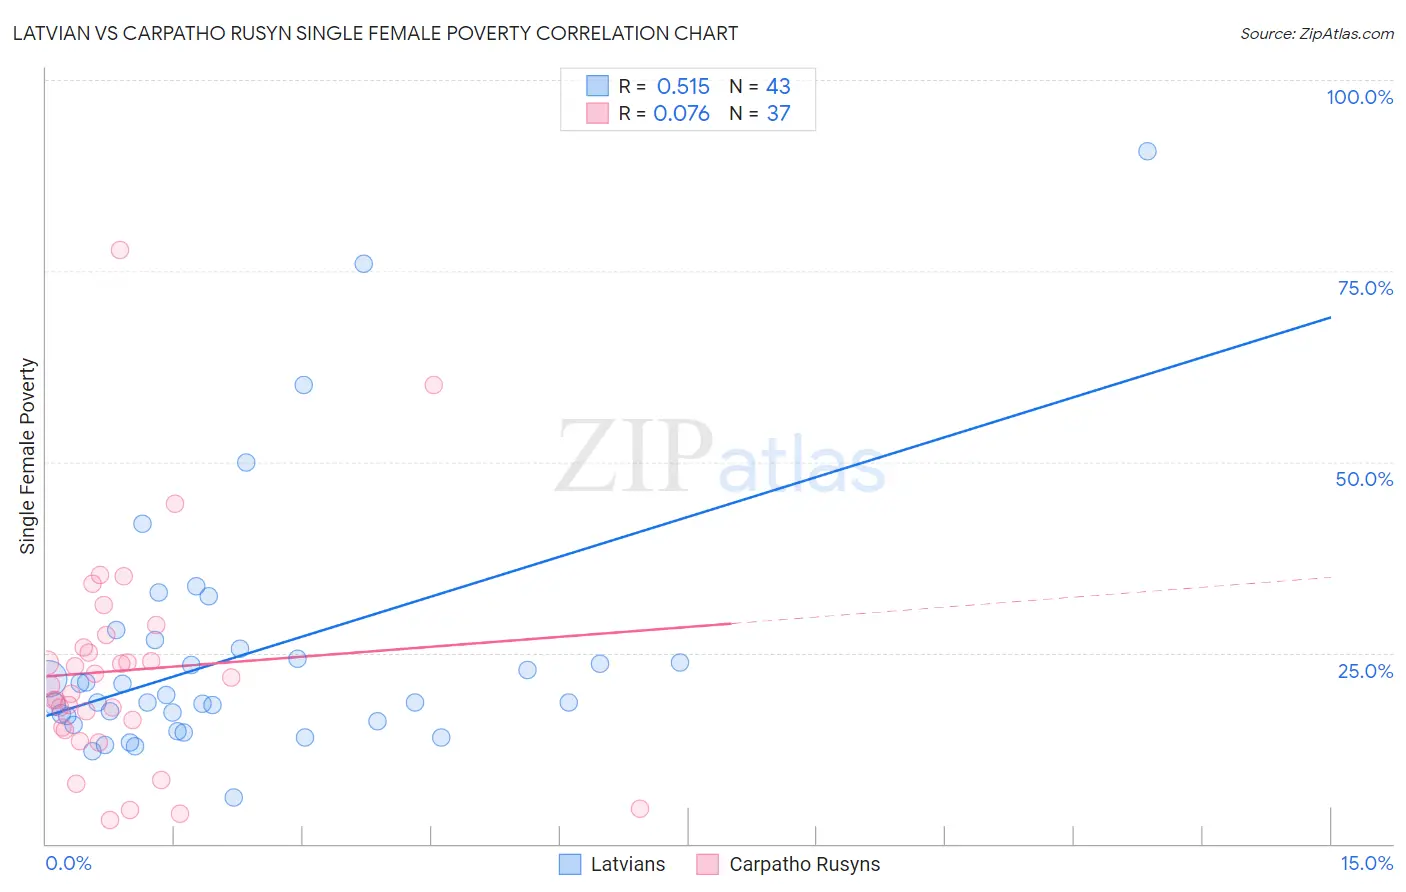
Latvian vs Carpatho Rusyn Single Female Poverty Correlation Chart
The statistical analysis conducted on geographies consisting of 217,777,893 people shows a substantial positive correlation between the proportion of Latvians and poverty level among single females in the United States with a correlation coefficient (R) of 0.515 and weighted average of 19.0%. Similarly, the statistical analysis conducted on geographies consisting of 58,553,439 people shows a slight positive correlation between the proportion of Carpatho Rusyns and poverty level among single females in the United States with a correlation coefficient (R) of 0.076 and weighted average of 20.0%, a difference of 5.1%.
Single Female Poverty Correlation Summary
| Measurement | Latvian | Carpatho Rusyn |
| Minimum | 6.0% | 3.1% |
| Maximum | 90.7% | 77.8% |
| Range | 84.7% | 74.7% |
| Mean | 24.7% | 22.7% |
| Median | 18.5% | 20.7% |
| Interquartile 25% (IQ1) | 16.0% | 15.1% |
| Interquartile 75% (IQ3) | 25.6% | 26.5% |
| Interquartile Range (IQR) | 9.5% | 11.4% |
| Standard Deviation (Sample) | 16.6% | 14.7% |
| Standard Deviation (Population) | 16.4% | 14.5% |
Similar Demographics by Single Female Poverty
Demographics Similar to Latvians by Single Female Poverty
In terms of single female poverty, the demographic groups most similar to Latvians are Macedonian (18.9%, a difference of 0.19%), Immigrants from Argentina (19.0%, a difference of 0.28%), Immigrants from Czechoslovakia (19.0%, a difference of 0.29%), Immigrants from Eastern Europe (19.0%, a difference of 0.33%), and Immigrants from Indonesia (18.9%, a difference of 0.35%).
| Demographics | Rating | Rank | Single Female Poverty |
| Okinawans | 99.9 /100 | #40 | Exceptional 18.8% |
| Immigrants | Serbia | 99.9 /100 | #41 | Exceptional 18.8% |
| Jordanians | 99.9 /100 | #42 | Exceptional 18.8% |
| Immigrants | Romania | 99.9 /100 | #43 | Exceptional 18.8% |
| Immigrants | Croatia | 99.9 /100 | #44 | Exceptional 18.9% |
| Immigrants | Indonesia | 99.8 /100 | #45 | Exceptional 18.9% |
| Macedonians | 99.8 /100 | #46 | Exceptional 18.9% |
| Latvians | 99.8 /100 | #47 | Exceptional 19.0% |
| Immigrants | Argentina | 99.8 /100 | #48 | Exceptional 19.0% |
| Immigrants | Czechoslovakia | 99.8 /100 | #49 | Exceptional 19.0% |
| Immigrants | Eastern Europe | 99.8 /100 | #50 | Exceptional 19.0% |
| Immigrants | Italy | 99.8 /100 | #51 | Exceptional 19.0% |
| Egyptians | 99.7 /100 | #52 | Exceptional 19.1% |
| Tsimshian | 99.7 /100 | #53 | Exceptional 19.1% |
| Argentineans | 99.7 /100 | #54 | Exceptional 19.1% |
Demographics Similar to Carpatho Rusyns by Single Female Poverty
In terms of single female poverty, the demographic groups most similar to Carpatho Rusyns are Immigrants from Netherlands (20.0%, a difference of 0.060%), Immigrants from Zimbabwe (20.0%, a difference of 0.12%), Immigrants from Colombia (20.0%, a difference of 0.12%), Immigrants from Northern Africa (20.0%, a difference of 0.14%), and Immigrants from Kazakhstan (20.0%, a difference of 0.17%).
| Demographics | Rating | Rank | Single Female Poverty |
| Chileans | 96.9 /100 | #104 | Exceptional 19.9% |
| Israelis | 96.9 /100 | #105 | Exceptional 19.9% |
| Ethiopians | 96.7 /100 | #106 | Exceptional 19.9% |
| Immigrants | Syria | 96.7 /100 | #107 | Exceptional 19.9% |
| Native Hawaiians | 96.6 /100 | #108 | Exceptional 19.9% |
| Colombians | 96.6 /100 | #109 | Exceptional 19.9% |
| Immigrants | Western Asia | 96.5 /100 | #110 | Exceptional 19.9% |
| Carpatho Rusyns | 96.1 /100 | #111 | Exceptional 20.0% |
| Immigrants | Netherlands | 96.0 /100 | #112 | Exceptional 20.0% |
| Immigrants | Zimbabwe | 95.9 /100 | #113 | Exceptional 20.0% |
| Immigrants | Colombia | 95.9 /100 | #114 | Exceptional 20.0% |
| Immigrants | Northern Africa | 95.8 /100 | #115 | Exceptional 20.0% |
| Immigrants | Kazakhstan | 95.7 /100 | #116 | Exceptional 20.0% |
| Poles | 95.6 /100 | #117 | Exceptional 20.0% |
| Immigrants | Afghanistan | 95.4 /100 | #118 | Exceptional 20.0% |