Latvian vs Brazilian Single Female Poverty
COMPARE
Latvian
Brazilian
Single Female Poverty
Single Female Poverty Comparison
Latvians
Brazilians
19.0%
SINGLE FEMALE POVERTY
99.8/ 100
METRIC RATING
47th/ 347
METRIC RANK
20.1%
SINGLE FEMALE POVERTY
94.4/ 100
METRIC RATING
123rd/ 347
METRIC RANK
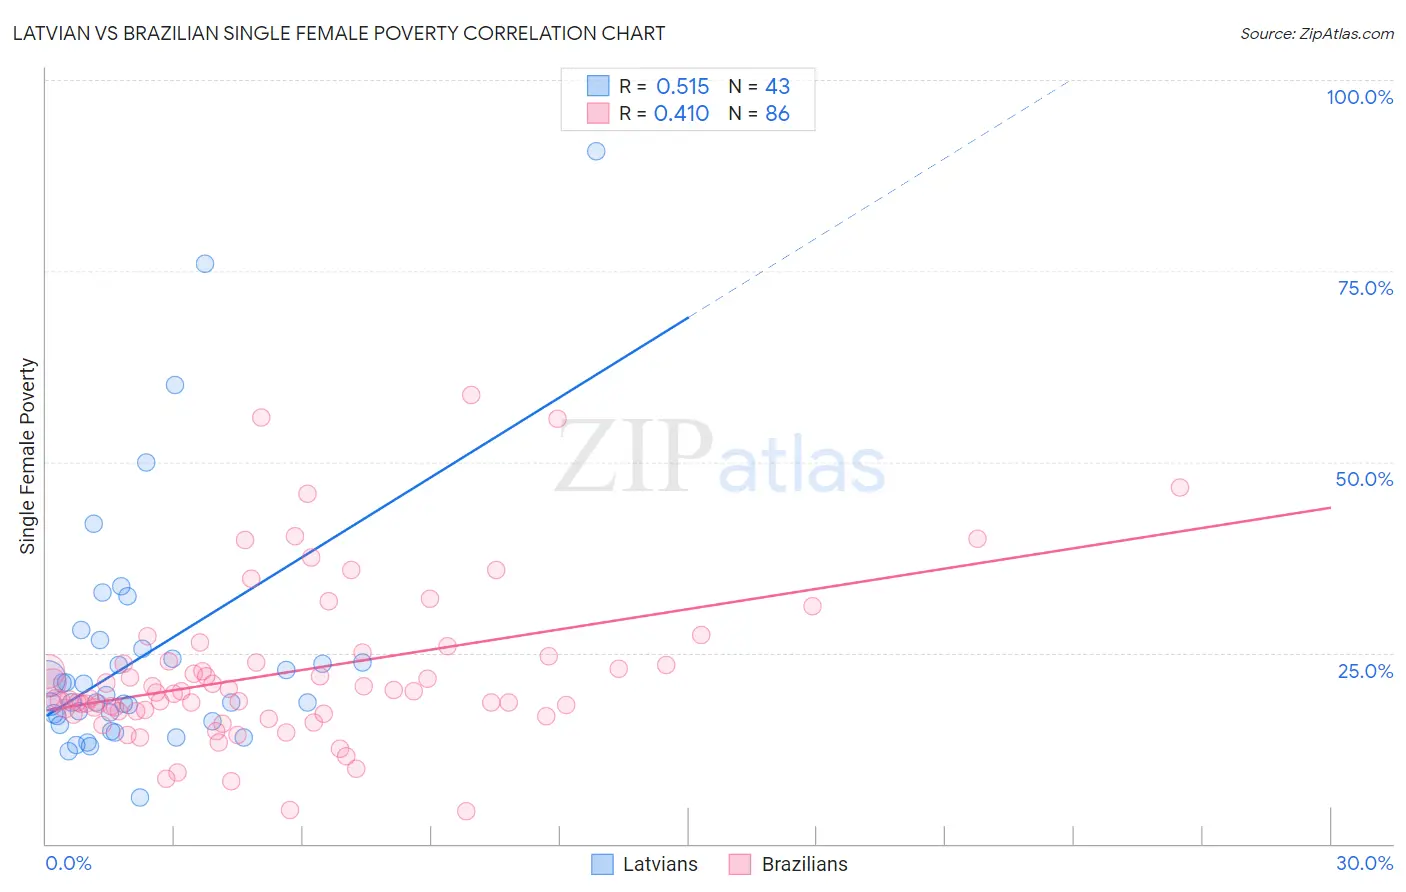
Latvian vs Brazilian Single Female Poverty Correlation Chart
The statistical analysis conducted on geographies consisting of 217,777,893 people shows a substantial positive correlation between the proportion of Latvians and poverty level among single females in the United States with a correlation coefficient (R) of 0.515 and weighted average of 19.0%. Similarly, the statistical analysis conducted on geographies consisting of 319,523,574 people shows a moderate positive correlation between the proportion of Brazilians and poverty level among single females in the United States with a correlation coefficient (R) of 0.410 and weighted average of 20.1%, a difference of 5.8%.
Single Female Poverty Correlation Summary
| Measurement | Latvian | Brazilian |
| Minimum | 6.0% | 4.3% |
| Maximum | 90.7% | 58.7% |
| Range | 84.7% | 54.4% |
| Mean | 24.7% | 22.4% |
| Median | 18.5% | 19.7% |
| Interquartile 25% (IQ1) | 16.0% | 17.3% |
| Interquartile 75% (IQ3) | 25.6% | 23.9% |
| Interquartile Range (IQR) | 9.5% | 6.6% |
| Standard Deviation (Sample) | 16.6% | 10.5% |
| Standard Deviation (Population) | 16.4% | 10.4% |
Similar Demographics by Single Female Poverty
Demographics Similar to Latvians by Single Female Poverty
In terms of single female poverty, the demographic groups most similar to Latvians are Macedonian (18.9%, a difference of 0.19%), Immigrants from Argentina (19.0%, a difference of 0.28%), Immigrants from Czechoslovakia (19.0%, a difference of 0.29%), Immigrants from Eastern Europe (19.0%, a difference of 0.33%), and Immigrants from Indonesia (18.9%, a difference of 0.35%).
| Demographics | Rating | Rank | Single Female Poverty |
| Okinawans | 99.9 /100 | #40 | Exceptional 18.8% |
| Immigrants | Serbia | 99.9 /100 | #41 | Exceptional 18.8% |
| Jordanians | 99.9 /100 | #42 | Exceptional 18.8% |
| Immigrants | Romania | 99.9 /100 | #43 | Exceptional 18.8% |
| Immigrants | Croatia | 99.9 /100 | #44 | Exceptional 18.9% |
| Immigrants | Indonesia | 99.8 /100 | #45 | Exceptional 18.9% |
| Macedonians | 99.8 /100 | #46 | Exceptional 18.9% |
| Latvians | 99.8 /100 | #47 | Exceptional 19.0% |
| Immigrants | Argentina | 99.8 /100 | #48 | Exceptional 19.0% |
| Immigrants | Czechoslovakia | 99.8 /100 | #49 | Exceptional 19.0% |
| Immigrants | Eastern Europe | 99.8 /100 | #50 | Exceptional 19.0% |
| Immigrants | Italy | 99.8 /100 | #51 | Exceptional 19.0% |
| Egyptians | 99.7 /100 | #52 | Exceptional 19.1% |
| Tsimshian | 99.7 /100 | #53 | Exceptional 19.1% |
| Argentineans | 99.7 /100 | #54 | Exceptional 19.1% |
Demographics Similar to Brazilians by Single Female Poverty
In terms of single female poverty, the demographic groups most similar to Brazilians are Immigrants from Chile (20.1%, a difference of 0.030%), Immigrants from South Africa (20.1%, a difference of 0.15%), Immigrants from South America (20.0%, a difference of 0.18%), Immigrants from Switzerland (20.0%, a difference of 0.21%), and South American (20.0%, a difference of 0.24%).
| Demographics | Rating | Rank | Single Female Poverty |
| Immigrants | Kazakhstan | 95.7 /100 | #116 | Exceptional 20.0% |
| Poles | 95.6 /100 | #117 | Exceptional 20.0% |
| Immigrants | Afghanistan | 95.4 /100 | #118 | Exceptional 20.0% |
| Immigrants | Ethiopia | 95.4 /100 | #119 | Exceptional 20.0% |
| South Americans | 95.1 /100 | #120 | Exceptional 20.0% |
| Immigrants | Switzerland | 95.1 /100 | #121 | Exceptional 20.0% |
| Immigrants | South America | 95.0 /100 | #122 | Exceptional 20.0% |
| Brazilians | 94.4 /100 | #123 | Exceptional 20.1% |
| Immigrants | Chile | 94.3 /100 | #124 | Exceptional 20.1% |
| Immigrants | South Africa | 93.9 /100 | #125 | Exceptional 20.1% |
| Serbians | 93.3 /100 | #126 | Exceptional 20.1% |
| Mongolians | 93.2 /100 | #127 | Exceptional 20.2% |
| Immigrants | Spain | 92.7 /100 | #128 | Exceptional 20.2% |
| Immigrants | Morocco | 92.4 /100 | #129 | Exceptional 20.2% |
| Immigrants | Hungary | 92.3 /100 | #130 | Exceptional 20.2% |