Ethiopian vs French Canadian Single Female Poverty
COMPARE
Ethiopian
French Canadian
Single Female Poverty
Single Female Poverty Comparison
Ethiopians
French Canadians
19.9%
SINGLE FEMALE POVERTY
96.7/ 100
METRIC RATING
106th/ 347
METRIC RANK
22.2%
SINGLE FEMALE POVERTY
2.8/ 100
METRIC RATING
238th/ 347
METRIC RANK
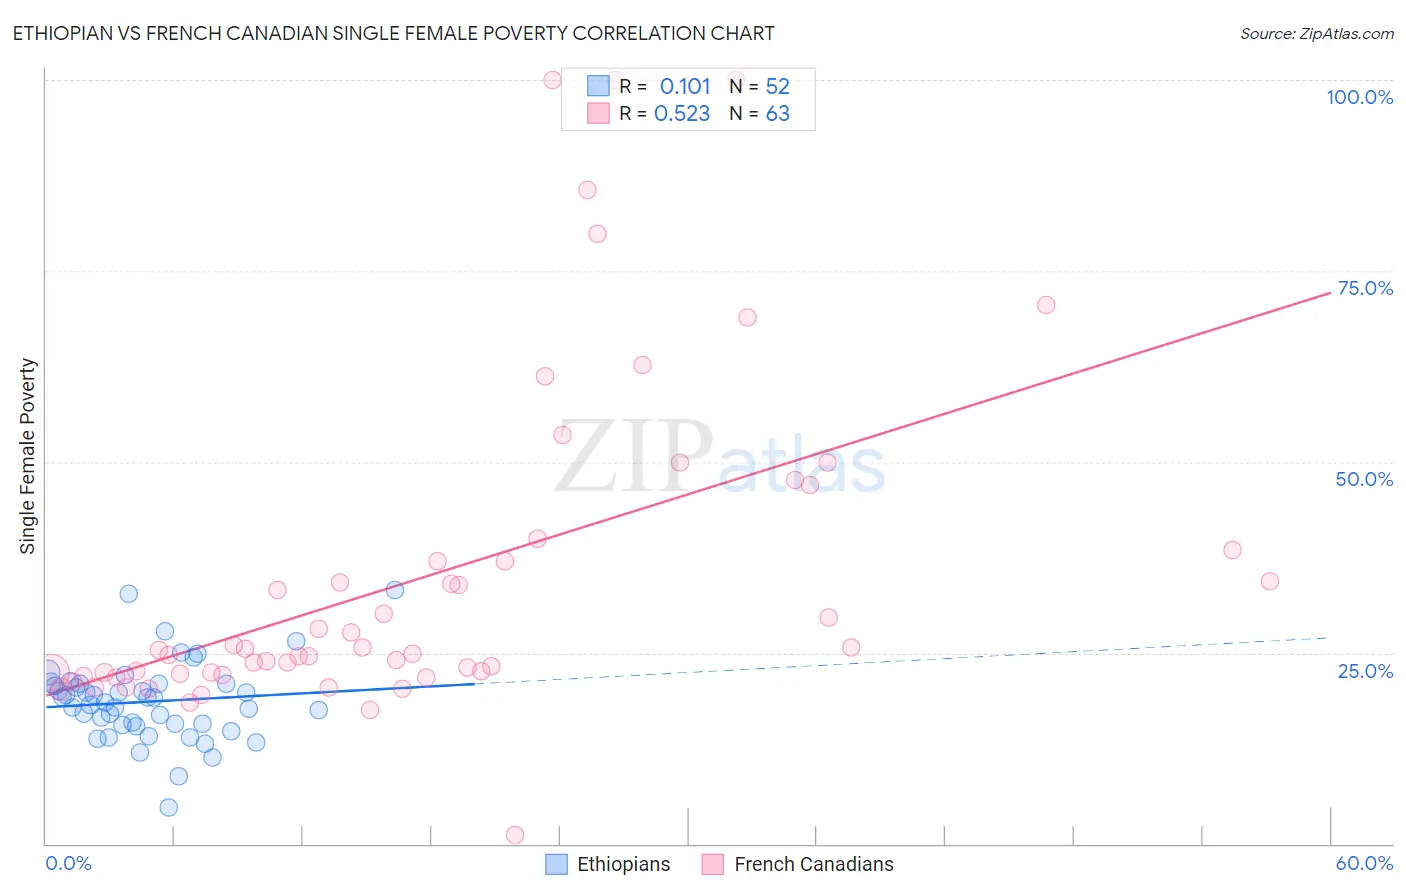
Ethiopian vs French Canadian Single Female Poverty Correlation Chart
The statistical analysis conducted on geographies consisting of 221,686,273 people shows a poor positive correlation between the proportion of Ethiopians and poverty level among single females in the United States with a correlation coefficient (R) of 0.101 and weighted average of 19.9%. Similarly, the statistical analysis conducted on geographies consisting of 489,180,966 people shows a substantial positive correlation between the proportion of French Canadians and poverty level among single females in the United States with a correlation coefficient (R) of 0.523 and weighted average of 22.2%, a difference of 11.4%.
Single Female Poverty Correlation Summary
| Measurement | Ethiopian | French Canadian |
| Minimum | 4.8% | 1.1% |
| Maximum | 33.2% | 100.0% |
| Range | 28.4% | 98.9% |
| Mean | 18.6% | 35.0% |
| Median | 18.8% | 25.4% |
| Interquartile 25% (IQ1) | 15.6% | 22.3% |
| Interquartile 75% (IQ3) | 20.9% | 38.4% |
| Interquartile Range (IQR) | 5.3% | 16.1% |
| Standard Deviation (Sample) | 5.2% | 21.7% |
| Standard Deviation (Population) | 5.1% | 21.5% |
Similar Demographics by Single Female Poverty
Demographics Similar to Ethiopians by Single Female Poverty
In terms of single female poverty, the demographic groups most similar to Ethiopians are Immigrants from Syria (19.9%, a difference of 0.020%), Native Hawaiian (19.9%, a difference of 0.070%), Colombian (19.9%, a difference of 0.070%), Immigrants from Western Asia (19.9%, a difference of 0.080%), and Israeli (19.9%, a difference of 0.090%).
| Demographics | Rating | Rank | Single Female Poverty |
| Sierra Leoneans | 97.9 /100 | #99 | Exceptional 19.7% |
| Ukrainians | 97.6 /100 | #100 | Exceptional 19.8% |
| Immigrants | Belgium | 97.3 /100 | #101 | Exceptional 19.8% |
| Immigrants | Cameroon | 97.3 /100 | #102 | Exceptional 19.8% |
| Immigrants | Southern Europe | 97.1 /100 | #103 | Exceptional 19.9% |
| Chileans | 96.9 /100 | #104 | Exceptional 19.9% |
| Israelis | 96.9 /100 | #105 | Exceptional 19.9% |
| Ethiopians | 96.7 /100 | #106 | Exceptional 19.9% |
| Immigrants | Syria | 96.7 /100 | #107 | Exceptional 19.9% |
| Native Hawaiians | 96.6 /100 | #108 | Exceptional 19.9% |
| Colombians | 96.6 /100 | #109 | Exceptional 19.9% |
| Immigrants | Western Asia | 96.5 /100 | #110 | Exceptional 19.9% |
| Carpatho Rusyns | 96.1 /100 | #111 | Exceptional 20.0% |
| Immigrants | Netherlands | 96.0 /100 | #112 | Exceptional 20.0% |
| Immigrants | Zimbabwe | 95.9 /100 | #113 | Exceptional 20.0% |
Demographics Similar to French Canadians by Single Female Poverty
In terms of single female poverty, the demographic groups most similar to French Canadians are Malaysian (22.2%, a difference of 0.0%), French (22.2%, a difference of 0.27%), Cape Verdean (22.3%, a difference of 0.41%), Bermudan (22.3%, a difference of 0.48%), and Vietnamese (22.0%, a difference of 0.55%).
| Demographics | Rating | Rank | Single Female Poverty |
| Welsh | 5.0 /100 | #231 | Tragic 22.0% |
| Immigrants | Thailand | 5.0 /100 | #232 | Tragic 22.0% |
| Spaniards | 4.7 /100 | #233 | Tragic 22.0% |
| Spanish | 4.7 /100 | #234 | Tragic 22.0% |
| Dutch | 4.6 /100 | #235 | Tragic 22.0% |
| Immigrants | Ecuador | 4.2 /100 | #236 | Tragic 22.0% |
| Vietnamese | 4.0 /100 | #237 | Tragic 22.0% |
| French Canadians | 2.8 /100 | #238 | Tragic 22.2% |
| Malaysians | 2.8 /100 | #239 | Tragic 22.2% |
| French | 2.3 /100 | #240 | Tragic 22.2% |
| Cape Verdeans | 2.1 /100 | #241 | Tragic 22.3% |
| Bermudans | 2.0 /100 | #242 | Tragic 22.3% |
| West Indians | 1.9 /100 | #243 | Tragic 22.3% |
| Immigrants | Middle Africa | 1.9 /100 | #244 | Tragic 22.3% |
| Immigrants | Bangladesh | 1.8 /100 | #245 | Tragic 22.3% |