Latvian vs Marshallese Single Female Poverty
COMPARE
Latvian
Marshallese
Single Female Poverty
Single Female Poverty Comparison
Latvians
Marshallese
19.0%
SINGLE FEMALE POVERTY
99.8/ 100
METRIC RATING
47th/ 347
METRIC RANK
23.3%
SINGLE FEMALE POVERTY
0.1/ 100
METRIC RATING
274th/ 347
METRIC RANK
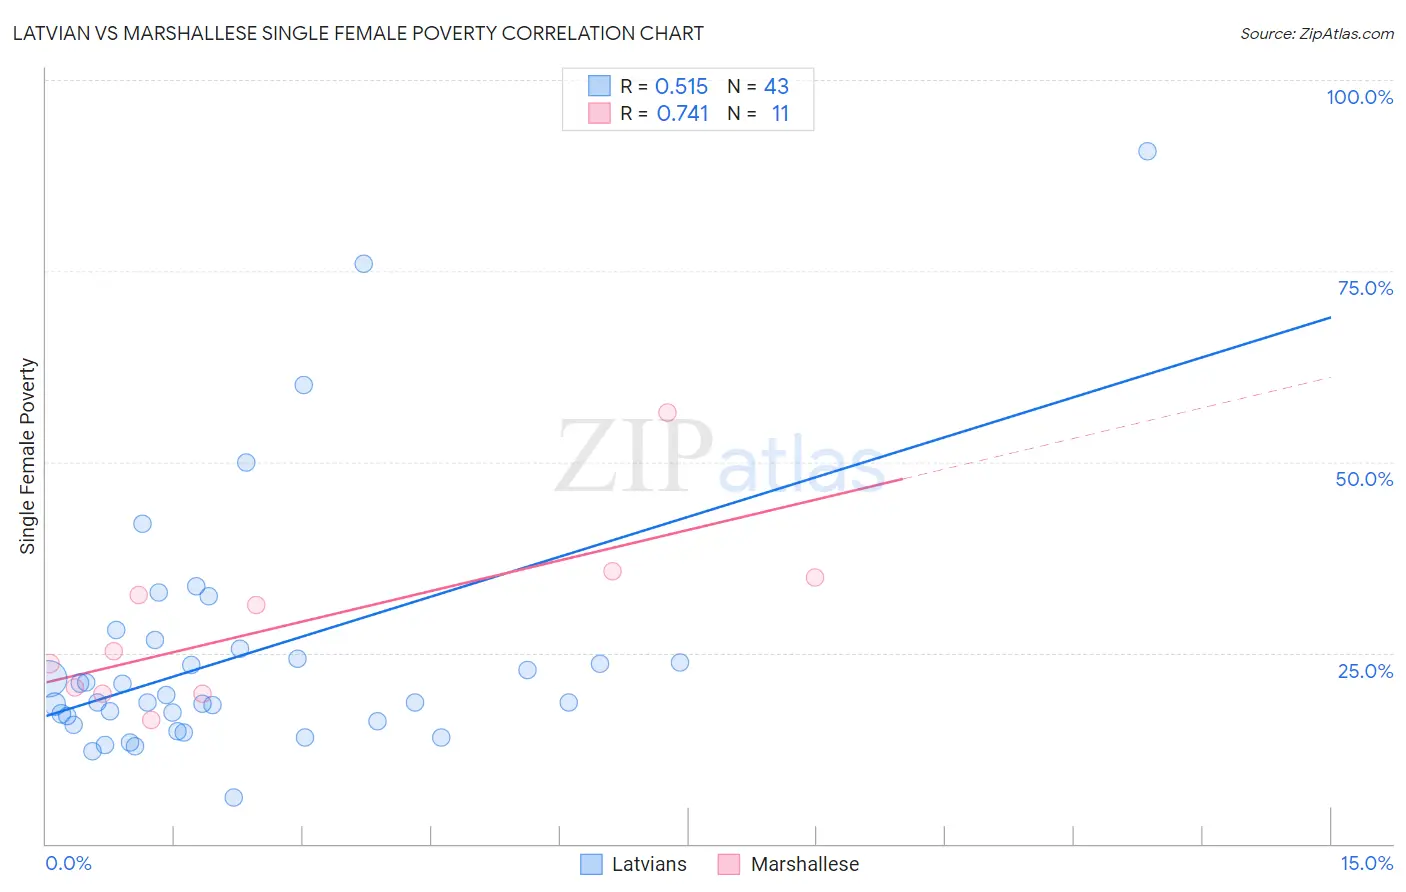
Latvian vs Marshallese Single Female Poverty Correlation Chart
The statistical analysis conducted on geographies consisting of 217,777,893 people shows a substantial positive correlation between the proportion of Latvians and poverty level among single females in the United States with a correlation coefficient (R) of 0.515 and weighted average of 19.0%. Similarly, the statistical analysis conducted on geographies consisting of 14,727,549 people shows a strong positive correlation between the proportion of Marshallese and poverty level among single females in the United States with a correlation coefficient (R) of 0.741 and weighted average of 23.3%, a difference of 22.7%.
Single Female Poverty Correlation Summary
| Measurement | Latvian | Marshallese |
| Minimum | 6.0% | 16.2% |
| Maximum | 90.7% | 56.5% |
| Range | 84.7% | 40.3% |
| Mean | 24.7% | 28.7% |
| Median | 18.5% | 25.2% |
| Interquartile 25% (IQ1) | 16.0% | 19.6% |
| Interquartile 75% (IQ3) | 25.6% | 34.8% |
| Interquartile Range (IQR) | 9.5% | 15.2% |
| Standard Deviation (Sample) | 16.6% | 11.4% |
| Standard Deviation (Population) | 16.4% | 10.9% |
Similar Demographics by Single Female Poverty
Demographics Similar to Latvians by Single Female Poverty
In terms of single female poverty, the demographic groups most similar to Latvians are Macedonian (18.9%, a difference of 0.19%), Immigrants from Argentina (19.0%, a difference of 0.28%), Immigrants from Czechoslovakia (19.0%, a difference of 0.29%), Immigrants from Eastern Europe (19.0%, a difference of 0.33%), and Immigrants from Indonesia (18.9%, a difference of 0.35%).
| Demographics | Rating | Rank | Single Female Poverty |
| Okinawans | 99.9 /100 | #40 | Exceptional 18.8% |
| Immigrants | Serbia | 99.9 /100 | #41 | Exceptional 18.8% |
| Jordanians | 99.9 /100 | #42 | Exceptional 18.8% |
| Immigrants | Romania | 99.9 /100 | #43 | Exceptional 18.8% |
| Immigrants | Croatia | 99.9 /100 | #44 | Exceptional 18.9% |
| Immigrants | Indonesia | 99.8 /100 | #45 | Exceptional 18.9% |
| Macedonians | 99.8 /100 | #46 | Exceptional 18.9% |
| Latvians | 99.8 /100 | #47 | Exceptional 19.0% |
| Immigrants | Argentina | 99.8 /100 | #48 | Exceptional 19.0% |
| Immigrants | Czechoslovakia | 99.8 /100 | #49 | Exceptional 19.0% |
| Immigrants | Eastern Europe | 99.8 /100 | #50 | Exceptional 19.0% |
| Immigrants | Italy | 99.8 /100 | #51 | Exceptional 19.0% |
| Egyptians | 99.7 /100 | #52 | Exceptional 19.1% |
| Tsimshian | 99.7 /100 | #53 | Exceptional 19.1% |
| Argentineans | 99.7 /100 | #54 | Exceptional 19.1% |
Demographics Similar to Marshallese by Single Female Poverty
In terms of single female poverty, the demographic groups most similar to Marshallese are Alaska Native (23.3%, a difference of 0.010%), Immigrants from Senegal (23.2%, a difference of 0.26%), Mexican American Indian (23.4%, a difference of 0.27%), Subsaharan African (23.2%, a difference of 0.45%), and Inupiat (23.1%, a difference of 0.69%).
| Demographics | Rating | Rank | Single Female Poverty |
| Senegalese | 0.2 /100 | #267 | Tragic 23.0% |
| Fijians | 0.2 /100 | #268 | Tragic 23.1% |
| Hmong | 0.2 /100 | #269 | Tragic 23.1% |
| Inupiat | 0.2 /100 | #270 | Tragic 23.1% |
| Sub-Saharan Africans | 0.1 /100 | #271 | Tragic 23.2% |
| Immigrants | Senegal | 0.1 /100 | #272 | Tragic 23.2% |
| Alaska Natives | 0.1 /100 | #273 | Tragic 23.3% |
| Marshallese | 0.1 /100 | #274 | Tragic 23.3% |
| Mexican American Indians | 0.1 /100 | #275 | Tragic 23.4% |
| Immigrants | Azores | 0.0 /100 | #276 | Tragic 23.5% |
| Pennsylvania Germans | 0.0 /100 | #277 | Tragic 23.6% |
| Immigrants | Nonimmigrants | 0.0 /100 | #278 | Tragic 23.6% |
| Alaskan Athabascans | 0.0 /100 | #279 | Tragic 23.6% |
| Immigrants | Latin America | 0.0 /100 | #280 | Tragic 23.7% |
| Immigrants | Zaire | 0.0 /100 | #281 | Tragic 23.8% |