American vs French Canadian Single Female Poverty
COMPARE
American
French Canadian
Single Female Poverty
Single Female Poverty Comparison
Americans
French Canadians
24.5%
SINGLE FEMALE POVERTY
0.0/ 100
METRIC RATING
293rd/ 347
METRIC RANK
22.2%
SINGLE FEMALE POVERTY
2.8/ 100
METRIC RATING
238th/ 347
METRIC RANK
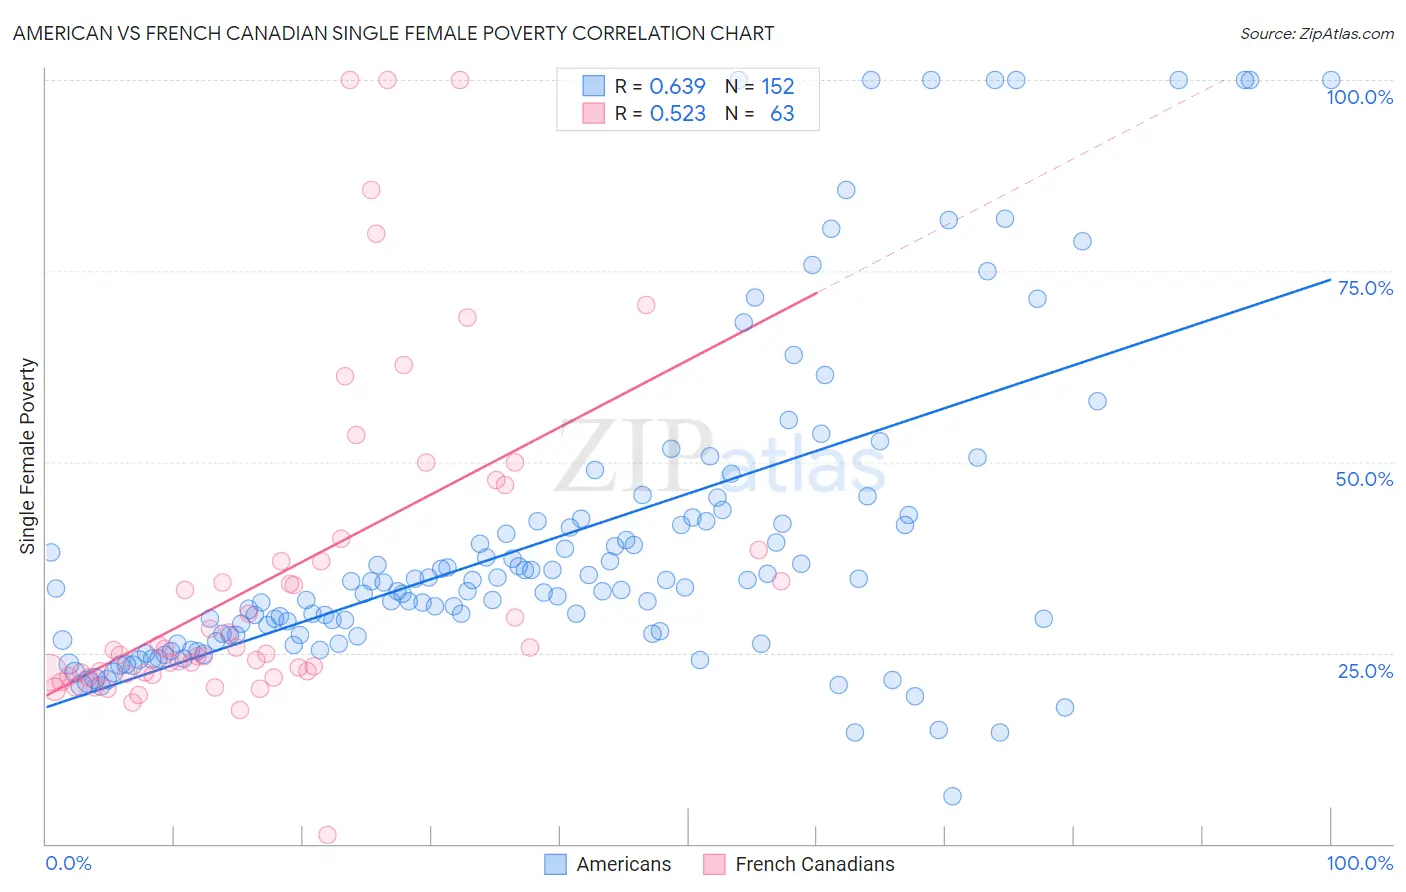
American vs French Canadian Single Female Poverty Correlation Chart
The statistical analysis conducted on geographies consisting of 559,828,526 people shows a significant positive correlation between the proportion of Americans and poverty level among single females in the United States with a correlation coefficient (R) of 0.639 and weighted average of 24.5%. Similarly, the statistical analysis conducted on geographies consisting of 489,180,966 people shows a substantial positive correlation between the proportion of French Canadians and poverty level among single females in the United States with a correlation coefficient (R) of 0.523 and weighted average of 22.2%, a difference of 10.6%.
Single Female Poverty Correlation Summary
| Measurement | American | French Canadian |
| Minimum | 6.2% | 1.1% |
| Maximum | 100.0% | 100.0% |
| Range | 93.8% | 98.9% |
| Mean | 39.7% | 35.0% |
| Median | 33.3% | 25.4% |
| Interquartile 25% (IQ1) | 27.3% | 22.3% |
| Interquartile 75% (IQ3) | 42.3% | 38.4% |
| Interquartile Range (IQR) | 15.0% | 16.1% |
| Standard Deviation (Sample) | 20.8% | 21.7% |
| Standard Deviation (Population) | 20.7% | 21.5% |
Similar Demographics by Single Female Poverty
Demographics Similar to Americans by Single Female Poverty
In terms of single female poverty, the demographic groups most similar to Americans are Alsatian (24.5%, a difference of 0.080%), French American Indian (24.6%, a difference of 0.15%), Osage (24.4%, a difference of 0.44%), Hispanic or Latino (24.6%, a difference of 0.49%), and African (24.8%, a difference of 0.98%).
| Demographics | Rating | Rank | Single Female Poverty |
| Cree | 0.0 /100 | #286 | Tragic 24.1% |
| Bangladeshis | 0.0 /100 | #287 | Tragic 24.2% |
| Spanish Americans | 0.0 /100 | #288 | Tragic 24.2% |
| U.S. Virgin Islanders | 0.0 /100 | #289 | Tragic 24.2% |
| Indonesians | 0.0 /100 | #290 | Tragic 24.3% |
| Osage | 0.0 /100 | #291 | Tragic 24.4% |
| Alsatians | 0.0 /100 | #292 | Tragic 24.5% |
| Americans | 0.0 /100 | #293 | Tragic 24.5% |
| French American Indians | 0.0 /100 | #294 | Tragic 24.6% |
| Hispanics or Latinos | 0.0 /100 | #295 | Tragic 24.6% |
| Africans | 0.0 /100 | #296 | Tragic 24.8% |
| Immigrants | Central America | 0.0 /100 | #297 | Tragic 24.8% |
| Yaqui | 0.0 /100 | #298 | Tragic 24.9% |
| Mexicans | 0.0 /100 | #299 | Tragic 25.0% |
| Blackfeet | 0.0 /100 | #300 | Tragic 25.1% |
Demographics Similar to French Canadians by Single Female Poverty
In terms of single female poverty, the demographic groups most similar to French Canadians are Malaysian (22.2%, a difference of 0.0%), French (22.2%, a difference of 0.27%), Cape Verdean (22.3%, a difference of 0.41%), Bermudan (22.3%, a difference of 0.48%), and Vietnamese (22.0%, a difference of 0.55%).
| Demographics | Rating | Rank | Single Female Poverty |
| Welsh | 5.0 /100 | #231 | Tragic 22.0% |
| Immigrants | Thailand | 5.0 /100 | #232 | Tragic 22.0% |
| Spaniards | 4.7 /100 | #233 | Tragic 22.0% |
| Spanish | 4.7 /100 | #234 | Tragic 22.0% |
| Dutch | 4.6 /100 | #235 | Tragic 22.0% |
| Immigrants | Ecuador | 4.2 /100 | #236 | Tragic 22.0% |
| Vietnamese | 4.0 /100 | #237 | Tragic 22.0% |
| French Canadians | 2.8 /100 | #238 | Tragic 22.2% |
| Malaysians | 2.8 /100 | #239 | Tragic 22.2% |
| French | 2.3 /100 | #240 | Tragic 22.2% |
| Cape Verdeans | 2.1 /100 | #241 | Tragic 22.3% |
| Bermudans | 2.0 /100 | #242 | Tragic 22.3% |
| West Indians | 1.9 /100 | #243 | Tragic 22.3% |
| Immigrants | Middle Africa | 1.9 /100 | #244 | Tragic 22.3% |
| Immigrants | Bangladesh | 1.8 /100 | #245 | Tragic 22.3% |