Immigrants from Uganda vs French Canadian Single Female Poverty
COMPARE
Immigrants from Uganda
French Canadian
Single Female Poverty
Single Female Poverty Comparison
Immigrants from Uganda
French Canadians
20.3%
SINGLE FEMALE POVERTY
89.1/ 100
METRIC RATING
142nd/ 347
METRIC RANK
22.2%
SINGLE FEMALE POVERTY
2.8/ 100
METRIC RATING
238th/ 347
METRIC RANK
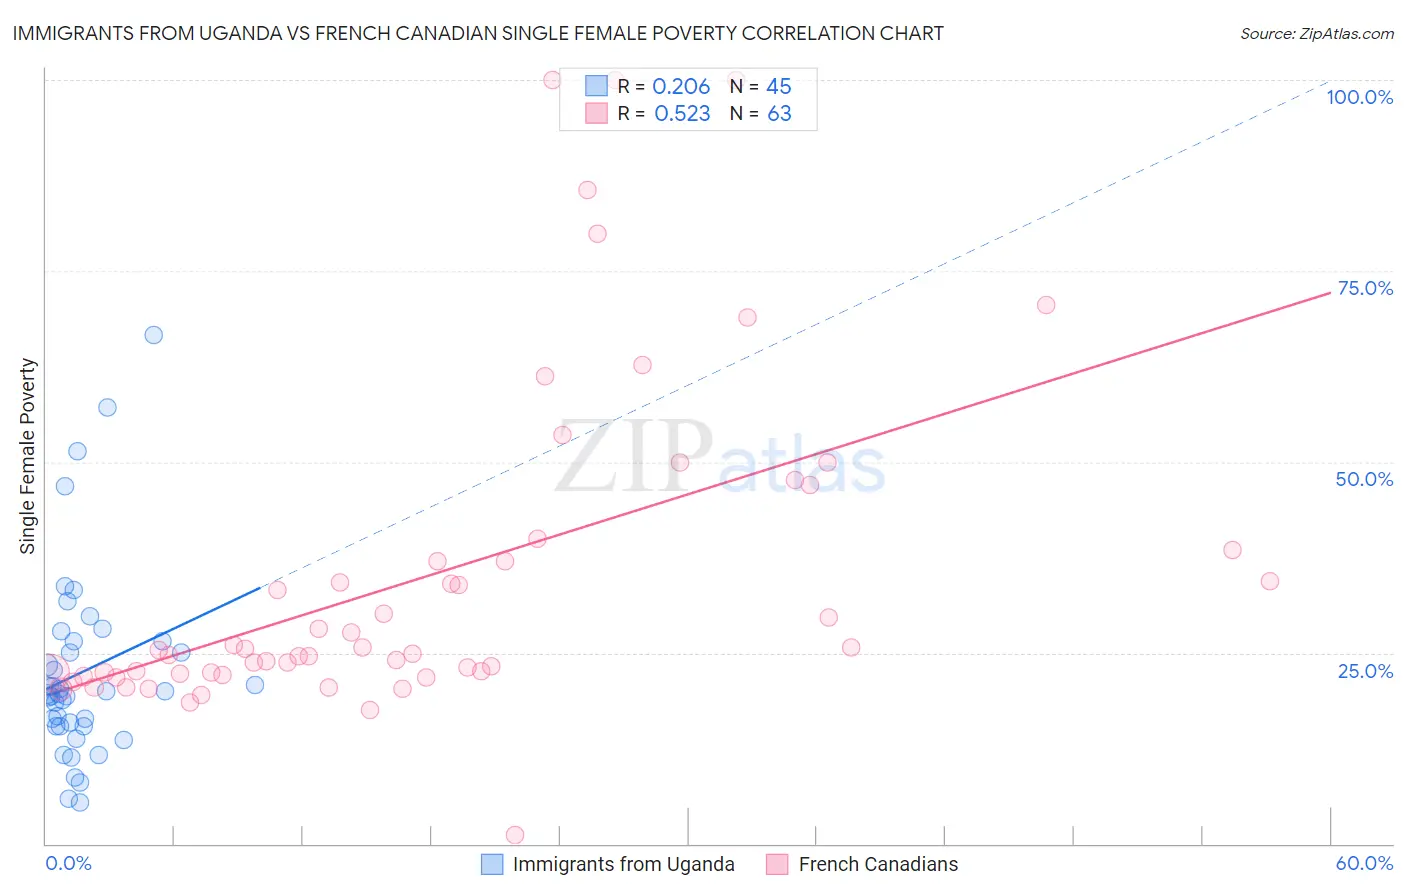
Immigrants from Uganda vs French Canadian Single Female Poverty Correlation Chart
The statistical analysis conducted on geographies consisting of 125,509,533 people shows a weak positive correlation between the proportion of Immigrants from Uganda and poverty level among single females in the United States with a correlation coefficient (R) of 0.206 and weighted average of 20.3%. Similarly, the statistical analysis conducted on geographies consisting of 489,180,966 people shows a substantial positive correlation between the proportion of French Canadians and poverty level among single females in the United States with a correlation coefficient (R) of 0.523 and weighted average of 22.2%, a difference of 9.1%.
Single Female Poverty Correlation Summary
| Measurement | Immigrants from Uganda | French Canadian |
| Minimum | 5.5% | 1.1% |
| Maximum | 66.7% | 100.0% |
| Range | 61.2% | 98.9% |
| Mean | 22.5% | 35.0% |
| Median | 19.7% | 25.4% |
| Interquartile 25% (IQ1) | 15.4% | 22.3% |
| Interquartile 75% (IQ3) | 26.5% | 38.4% |
| Interquartile Range (IQR) | 11.1% | 16.1% |
| Standard Deviation (Sample) | 12.6% | 21.7% |
| Standard Deviation (Population) | 12.4% | 21.5% |
Similar Demographics by Single Female Poverty
Demographics Similar to Immigrants from Uganda by Single Female Poverty
In terms of single female poverty, the demographic groups most similar to Immigrants from Uganda are Immigrants from North America (20.3%, a difference of 0.080%), Australian (20.3%, a difference of 0.12%), Immigrants from Uzbekistan (20.3%, a difference of 0.13%), Immigrants from Kuwait (20.3%, a difference of 0.23%), and Syrian (20.3%, a difference of 0.23%).
| Demographics | Rating | Rank | Single Female Poverty |
| Immigrants | Iraq | 91.2 /100 | #135 | Exceptional 20.2% |
| Immigrants | Canada | 91.2 /100 | #136 | Exceptional 20.2% |
| Immigrants | Nepal | 90.6 /100 | #137 | Exceptional 20.3% |
| Slovenes | 90.5 /100 | #138 | Exceptional 20.3% |
| Immigrants | Kuwait | 90.4 /100 | #139 | Exceptional 20.3% |
| Syrians | 90.4 /100 | #140 | Exceptional 20.3% |
| Immigrants | North America | 89.5 /100 | #141 | Excellent 20.3% |
| Immigrants | Uganda | 89.1 /100 | #142 | Excellent 20.3% |
| Australians | 88.4 /100 | #143 | Excellent 20.3% |
| Immigrants | Uzbekistan | 88.3 /100 | #144 | Excellent 20.3% |
| Austrians | 85.8 /100 | #145 | Excellent 20.4% |
| Venezuelans | 85.5 /100 | #146 | Excellent 20.4% |
| South Africans | 85.3 /100 | #147 | Excellent 20.4% |
| Luxembourgers | 84.9 /100 | #148 | Excellent 20.4% |
| Portuguese | 81.5 /100 | #149 | Excellent 20.5% |
Demographics Similar to French Canadians by Single Female Poverty
In terms of single female poverty, the demographic groups most similar to French Canadians are Malaysian (22.2%, a difference of 0.0%), French (22.2%, a difference of 0.27%), Cape Verdean (22.3%, a difference of 0.41%), Bermudan (22.3%, a difference of 0.48%), and Vietnamese (22.0%, a difference of 0.55%).
| Demographics | Rating | Rank | Single Female Poverty |
| Welsh | 5.0 /100 | #231 | Tragic 22.0% |
| Immigrants | Thailand | 5.0 /100 | #232 | Tragic 22.0% |
| Spaniards | 4.7 /100 | #233 | Tragic 22.0% |
| Spanish | 4.7 /100 | #234 | Tragic 22.0% |
| Dutch | 4.6 /100 | #235 | Tragic 22.0% |
| Immigrants | Ecuador | 4.2 /100 | #236 | Tragic 22.0% |
| Vietnamese | 4.0 /100 | #237 | Tragic 22.0% |
| French Canadians | 2.8 /100 | #238 | Tragic 22.2% |
| Malaysians | 2.8 /100 | #239 | Tragic 22.2% |
| French | 2.3 /100 | #240 | Tragic 22.2% |
| Cape Verdeans | 2.1 /100 | #241 | Tragic 22.3% |
| Bermudans | 2.0 /100 | #242 | Tragic 22.3% |
| West Indians | 1.9 /100 | #243 | Tragic 22.3% |
| Immigrants | Middle Africa | 1.9 /100 | #244 | Tragic 22.3% |
| Immigrants | Bangladesh | 1.8 /100 | #245 | Tragic 22.3% |