Kenyan vs Latvian Single Female Poverty
COMPARE
Kenyan
Latvian
Single Female Poverty
Single Female Poverty Comparison
Kenyans
Latvians
20.8%
SINGLE FEMALE POVERTY
68.5/ 100
METRIC RATING
161st/ 347
METRIC RANK
19.0%
SINGLE FEMALE POVERTY
99.8/ 100
METRIC RATING
47th/ 347
METRIC RANK
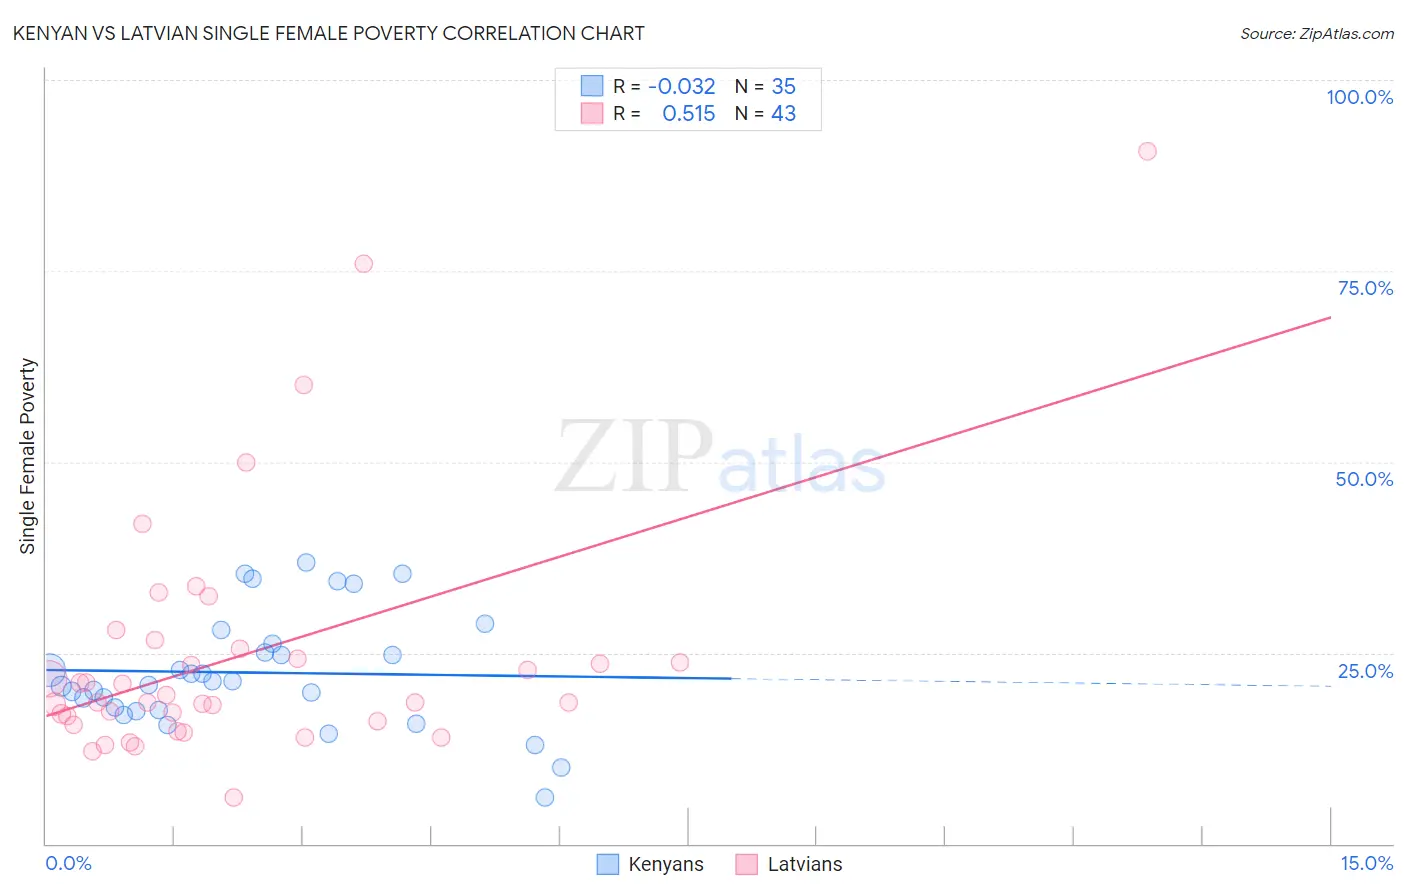
Kenyan vs Latvian Single Female Poverty Correlation Chart
The statistical analysis conducted on geographies consisting of 167,254,696 people shows no correlation between the proportion of Kenyans and poverty level among single females in the United States with a correlation coefficient (R) of -0.032 and weighted average of 20.8%. Similarly, the statistical analysis conducted on geographies consisting of 217,777,893 people shows a substantial positive correlation between the proportion of Latvians and poverty level among single females in the United States with a correlation coefficient (R) of 0.515 and weighted average of 19.0%, a difference of 9.3%.
Single Female Poverty Correlation Summary
| Measurement | Kenyan | Latvian |
| Minimum | 6.1% | 6.0% |
| Maximum | 36.9% | 90.7% |
| Range | 30.8% | 84.7% |
| Mean | 22.4% | 24.7% |
| Median | 21.2% | 18.5% |
| Interquartile 25% (IQ1) | 17.6% | 16.0% |
| Interquartile 75% (IQ3) | 26.1% | 25.6% |
| Interquartile Range (IQR) | 8.6% | 9.5% |
| Standard Deviation (Sample) | 7.5% | 16.6% |
| Standard Deviation (Population) | 7.4% | 16.4% |
Similar Demographics by Single Female Poverty
Demographics Similar to Kenyans by Single Female Poverty
In terms of single female poverty, the demographic groups most similar to Kenyans are Northern European (20.8%, a difference of 0.010%), Lebanese (20.8%, a difference of 0.060%), Arab (20.7%, a difference of 0.18%), Costa Rican (20.7%, a difference of 0.25%), and Iraqi (20.8%, a difference of 0.28%).
| Demographics | Rating | Rank | Single Female Poverty |
| Immigrants | Western Europe | 76.7 /100 | #154 | Good 20.6% |
| Samoans | 76.0 /100 | #155 | Good 20.6% |
| South American Indians | 75.7 /100 | #156 | Good 20.6% |
| Immigrants | Oceania | 74.3 /100 | #157 | Good 20.7% |
| Danes | 73.0 /100 | #158 | Good 20.7% |
| Costa Ricans | 71.8 /100 | #159 | Good 20.7% |
| Arabs | 70.8 /100 | #160 | Good 20.7% |
| Kenyans | 68.5 /100 | #161 | Good 20.8% |
| Northern Europeans | 68.4 /100 | #162 | Good 20.8% |
| Lebanese | 67.6 /100 | #163 | Good 20.8% |
| Iraqis | 64.5 /100 | #164 | Good 20.8% |
| Ugandans | 64.0 /100 | #165 | Good 20.8% |
| Norwegians | 63.0 /100 | #166 | Good 20.8% |
| Immigrants | Norway | 63.0 /100 | #167 | Good 20.8% |
| Immigrants | Costa Rica | 61.5 /100 | #168 | Good 20.9% |
Demographics Similar to Latvians by Single Female Poverty
In terms of single female poverty, the demographic groups most similar to Latvians are Macedonian (18.9%, a difference of 0.19%), Immigrants from Argentina (19.0%, a difference of 0.28%), Immigrants from Czechoslovakia (19.0%, a difference of 0.29%), Immigrants from Eastern Europe (19.0%, a difference of 0.33%), and Immigrants from Indonesia (18.9%, a difference of 0.35%).
| Demographics | Rating | Rank | Single Female Poverty |
| Okinawans | 99.9 /100 | #40 | Exceptional 18.8% |
| Immigrants | Serbia | 99.9 /100 | #41 | Exceptional 18.8% |
| Jordanians | 99.9 /100 | #42 | Exceptional 18.8% |
| Immigrants | Romania | 99.9 /100 | #43 | Exceptional 18.8% |
| Immigrants | Croatia | 99.9 /100 | #44 | Exceptional 18.9% |
| Immigrants | Indonesia | 99.8 /100 | #45 | Exceptional 18.9% |
| Macedonians | 99.8 /100 | #46 | Exceptional 18.9% |
| Latvians | 99.8 /100 | #47 | Exceptional 19.0% |
| Immigrants | Argentina | 99.8 /100 | #48 | Exceptional 19.0% |
| Immigrants | Czechoslovakia | 99.8 /100 | #49 | Exceptional 19.0% |
| Immigrants | Eastern Europe | 99.8 /100 | #50 | Exceptional 19.0% |
| Immigrants | Italy | 99.8 /100 | #51 | Exceptional 19.0% |
| Egyptians | 99.7 /100 | #52 | Exceptional 19.1% |
| Tsimshian | 99.7 /100 | #53 | Exceptional 19.1% |
| Argentineans | 99.7 /100 | #54 | Exceptional 19.1% |