Kenyan vs Latvian 10th Grade
COMPARE
Kenyan
Latvian
10th Grade
10th Grade Comparison
Kenyans
Latvians
94.0%
10TH GRADE
79.1/ 100
METRIC RATING
151st/ 347
METRIC RANK
95.6%
10TH GRADE
100.0/ 100
METRIC RATING
17th/ 347
METRIC RANK
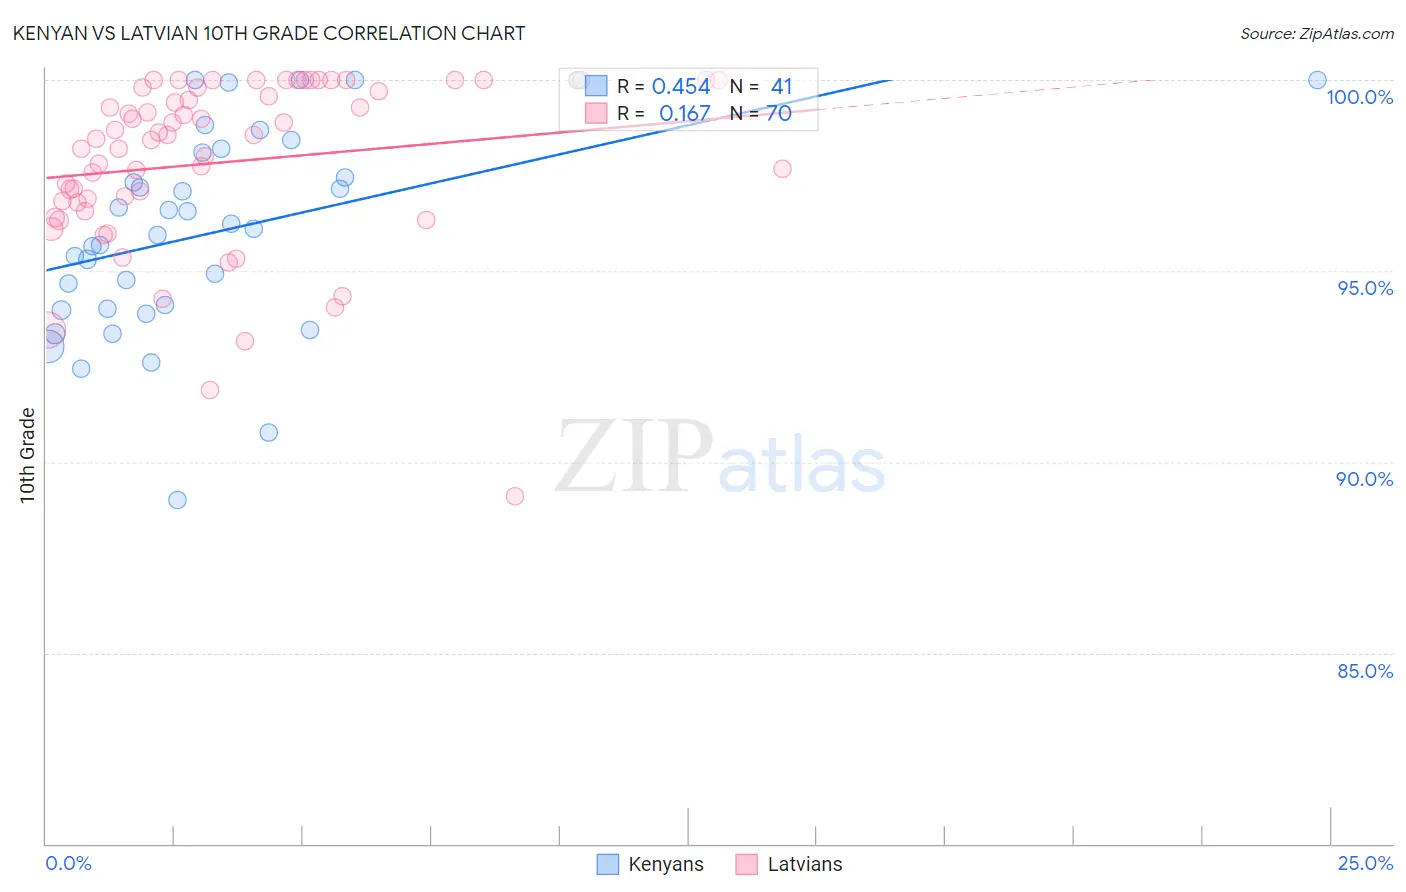
Kenyan vs Latvian 10th Grade Correlation Chart
The statistical analysis conducted on geographies consisting of 168,244,042 people shows a moderate positive correlation between the proportion of Kenyans and percentage of population with at least 10th grade education in the United States with a correlation coefficient (R) of 0.454 and weighted average of 94.0%. Similarly, the statistical analysis conducted on geographies consisting of 220,726,693 people shows a poor positive correlation between the proportion of Latvians and percentage of population with at least 10th grade education in the United States with a correlation coefficient (R) of 0.167 and weighted average of 95.6%, a difference of 1.7%.
10th Grade Correlation Summary
| Measurement | Kenyan | Latvian |
| Minimum | 89.0% | 89.1% |
| Maximum | 100.0% | 100.0% |
| Range | 11.0% | 10.9% |
| Mean | 96.0% | 97.8% |
| Median | 96.1% | 98.5% |
| Interquartile 25% (IQ1) | 94.0% | 96.8% |
| Interquartile 75% (IQ3) | 98.2% | 99.8% |
| Interquartile Range (IQR) | 4.2% | 3.0% |
| Standard Deviation (Sample) | 2.7% | 2.2% |
| Standard Deviation (Population) | 2.6% | 2.2% |
Similar Demographics by 10th Grade
Demographics Similar to Kenyans by 10th Grade
In terms of 10th grade, the demographic groups most similar to Kenyans are Egyptian (94.0%, a difference of 0.010%), Immigrants from Italy (94.0%, a difference of 0.010%), Ugandan (94.0%, a difference of 0.020%), Immigrants from Ukraine (94.0%, a difference of 0.030%), and Arab (94.0%, a difference of 0.030%).
| Demographics | Rating | Rank | 10th Grade |
| Immigrants | Kazakhstan | 84.9 /100 | #144 | Excellent 94.1% |
| Immigrants | Nonimmigrants | 83.8 /100 | #145 | Excellent 94.1% |
| Chickasaw | 82.6 /100 | #146 | Excellent 94.1% |
| Immigrants | Ukraine | 81.5 /100 | #147 | Excellent 94.0% |
| Arabs | 80.9 /100 | #148 | Excellent 94.0% |
| Ugandans | 80.7 /100 | #149 | Excellent 94.0% |
| Egyptians | 79.6 /100 | #150 | Good 94.0% |
| Kenyans | 79.1 /100 | #151 | Good 94.0% |
| Immigrants | Italy | 78.0 /100 | #152 | Good 94.0% |
| Immigrants | Brazil | 75.5 /100 | #153 | Good 94.0% |
| Immigrants | Kenya | 75.3 /100 | #154 | Good 94.0% |
| Spanish | 74.9 /100 | #155 | Good 94.0% |
| Mongolians | 74.4 /100 | #156 | Good 94.0% |
| Kiowa | 73.3 /100 | #157 | Good 93.9% |
| Bermudans | 71.0 /100 | #158 | Good 93.9% |
Demographics Similar to Latvians by 10th Grade
In terms of 10th grade, the demographic groups most similar to Latvians are Scottish (95.6%, a difference of 0.010%), Italian (95.6%, a difference of 0.010%), Scandinavian (95.6%, a difference of 0.010%), Irish (95.6%, a difference of 0.020%), and Chinese (95.5%, a difference of 0.030%).
| Demographics | Rating | Rank | 10th Grade |
| Croatians | 100.0 /100 | #10 | Exceptional 95.7% |
| Danes | 100.0 /100 | #11 | Exceptional 95.7% |
| Tlingit-Haida | 100.0 /100 | #12 | Exceptional 95.7% |
| English | 100.0 /100 | #13 | Exceptional 95.6% |
| Tsimshian | 100.0 /100 | #14 | Exceptional 95.6% |
| Irish | 100.0 /100 | #15 | Exceptional 95.6% |
| Scottish | 100.0 /100 | #16 | Exceptional 95.6% |
| Latvians | 100.0 /100 | #17 | Exceptional 95.6% |
| Italians | 100.0 /100 | #18 | Exceptional 95.6% |
| Scandinavians | 100.0 /100 | #19 | Exceptional 95.6% |
| Chinese | 100.0 /100 | #20 | Exceptional 95.5% |
| Dutch | 100.0 /100 | #21 | Exceptional 95.5% |
| Eastern Europeans | 100.0 /100 | #22 | Exceptional 95.5% |
| Czechs | 100.0 /100 | #23 | Exceptional 95.5% |
| Europeans | 100.0 /100 | #24 | Exceptional 95.5% |