Kenyan vs French American Indian Single Female Poverty
COMPARE
Kenyan
French American Indian
Single Female Poverty
Single Female Poverty Comparison
Kenyans
French American Indians
20.8%
SINGLE FEMALE POVERTY
68.5/ 100
METRIC RATING
161st/ 347
METRIC RANK
24.6%
SINGLE FEMALE POVERTY
0.0/ 100
METRIC RATING
294th/ 347
METRIC RANK
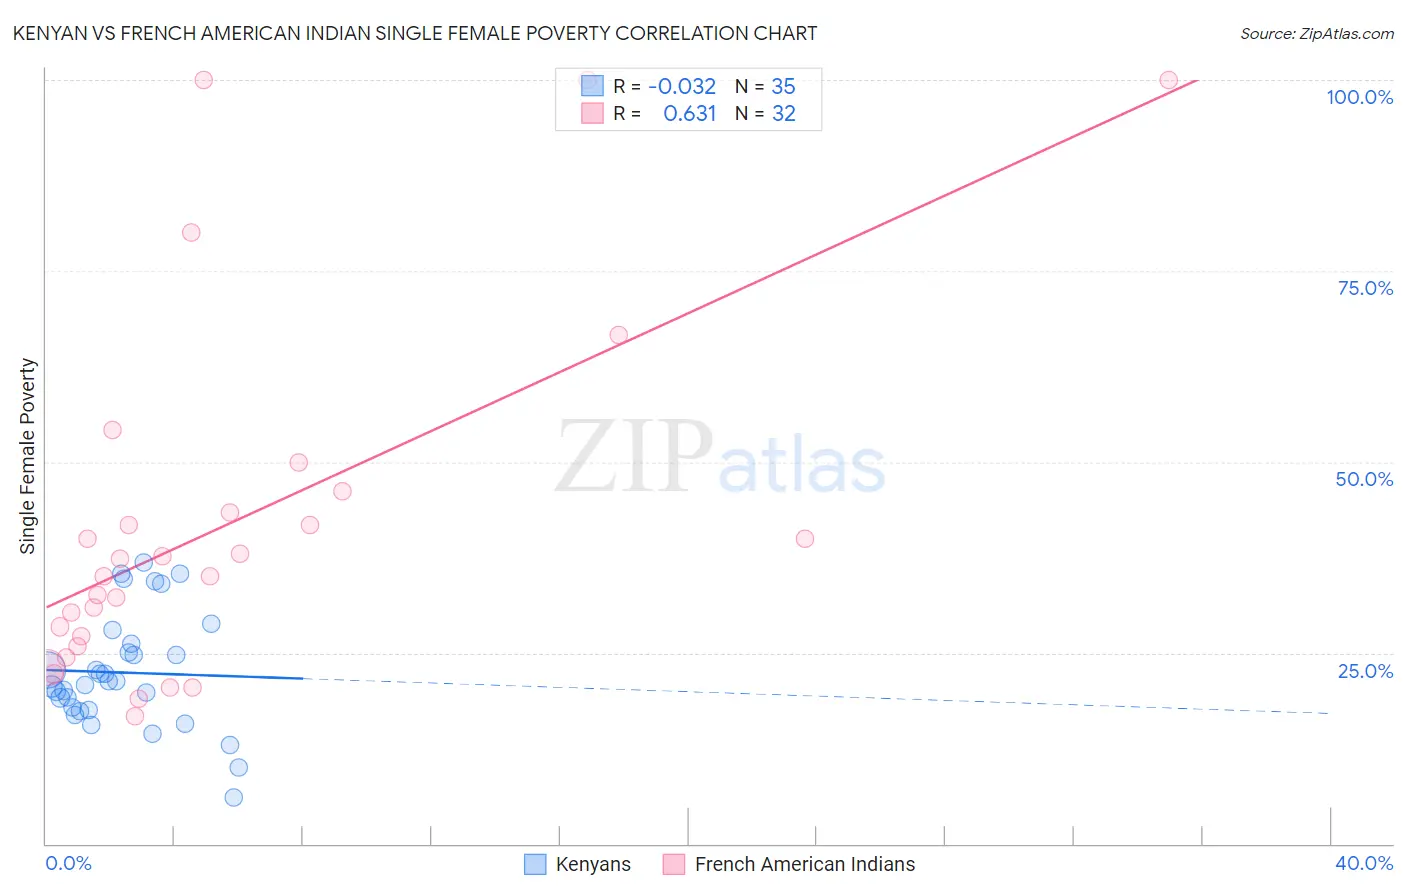
Kenyan vs French American Indian Single Female Poverty Correlation Chart
The statistical analysis conducted on geographies consisting of 167,254,696 people shows no correlation between the proportion of Kenyans and poverty level among single females in the United States with a correlation coefficient (R) of -0.032 and weighted average of 20.8%. Similarly, the statistical analysis conducted on geographies consisting of 131,011,978 people shows a significant positive correlation between the proportion of French American Indians and poverty level among single females in the United States with a correlation coefficient (R) of 0.631 and weighted average of 24.6%, a difference of 18.3%.
Single Female Poverty Correlation Summary
| Measurement | Kenyan | French American Indian |
| Minimum | 6.1% | 16.7% |
| Maximum | 36.9% | 100.0% |
| Range | 30.8% | 83.3% |
| Mean | 22.4% | 41.9% |
| Median | 21.2% | 36.2% |
| Interquartile 25% (IQ1) | 17.6% | 26.5% |
| Interquartile 75% (IQ3) | 26.1% | 44.8% |
| Interquartile Range (IQR) | 8.6% | 18.3% |
| Standard Deviation (Sample) | 7.5% | 23.3% |
| Standard Deviation (Population) | 7.4% | 22.9% |
Similar Demographics by Single Female Poverty
Demographics Similar to Kenyans by Single Female Poverty
In terms of single female poverty, the demographic groups most similar to Kenyans are Northern European (20.8%, a difference of 0.010%), Lebanese (20.8%, a difference of 0.060%), Arab (20.7%, a difference of 0.18%), Costa Rican (20.7%, a difference of 0.25%), and Iraqi (20.8%, a difference of 0.28%).
| Demographics | Rating | Rank | Single Female Poverty |
| Immigrants | Western Europe | 76.7 /100 | #154 | Good 20.6% |
| Samoans | 76.0 /100 | #155 | Good 20.6% |
| South American Indians | 75.7 /100 | #156 | Good 20.6% |
| Immigrants | Oceania | 74.3 /100 | #157 | Good 20.7% |
| Danes | 73.0 /100 | #158 | Good 20.7% |
| Costa Ricans | 71.8 /100 | #159 | Good 20.7% |
| Arabs | 70.8 /100 | #160 | Good 20.7% |
| Kenyans | 68.5 /100 | #161 | Good 20.8% |
| Northern Europeans | 68.4 /100 | #162 | Good 20.8% |
| Lebanese | 67.6 /100 | #163 | Good 20.8% |
| Iraqis | 64.5 /100 | #164 | Good 20.8% |
| Ugandans | 64.0 /100 | #165 | Good 20.8% |
| Norwegians | 63.0 /100 | #166 | Good 20.8% |
| Immigrants | Norway | 63.0 /100 | #167 | Good 20.8% |
| Immigrants | Costa Rica | 61.5 /100 | #168 | Good 20.9% |
Demographics Similar to French American Indians by Single Female Poverty
In terms of single female poverty, the demographic groups most similar to French American Indians are American (24.5%, a difference of 0.15%), Alsatian (24.5%, a difference of 0.23%), Hispanic or Latino (24.6%, a difference of 0.35%), Osage (24.4%, a difference of 0.59%), and African (24.8%, a difference of 0.83%).
| Demographics | Rating | Rank | Single Female Poverty |
| Bangladeshis | 0.0 /100 | #287 | Tragic 24.2% |
| Spanish Americans | 0.0 /100 | #288 | Tragic 24.2% |
| U.S. Virgin Islanders | 0.0 /100 | #289 | Tragic 24.2% |
| Indonesians | 0.0 /100 | #290 | Tragic 24.3% |
| Osage | 0.0 /100 | #291 | Tragic 24.4% |
| Alsatians | 0.0 /100 | #292 | Tragic 24.5% |
| Americans | 0.0 /100 | #293 | Tragic 24.5% |
| French American Indians | 0.0 /100 | #294 | Tragic 24.6% |
| Hispanics or Latinos | 0.0 /100 | #295 | Tragic 24.6% |
| Africans | 0.0 /100 | #296 | Tragic 24.8% |
| Immigrants | Central America | 0.0 /100 | #297 | Tragic 24.8% |
| Yaqui | 0.0 /100 | #298 | Tragic 24.9% |
| Mexicans | 0.0 /100 | #299 | Tragic 25.0% |
| Blackfeet | 0.0 /100 | #300 | Tragic 25.1% |
| Hondurans | 0.0 /100 | #301 | Tragic 25.1% |