Immigrants from Asia vs Latvian Single Female Poverty
COMPARE
Immigrants from Asia
Latvian
Single Female Poverty
Single Female Poverty Comparison
Immigrants from Asia
Latvians
18.6%
SINGLE FEMALE POVERTY
99.9/ 100
METRIC RATING
31st/ 347
METRIC RANK
19.0%
SINGLE FEMALE POVERTY
99.8/ 100
METRIC RATING
47th/ 347
METRIC RANK
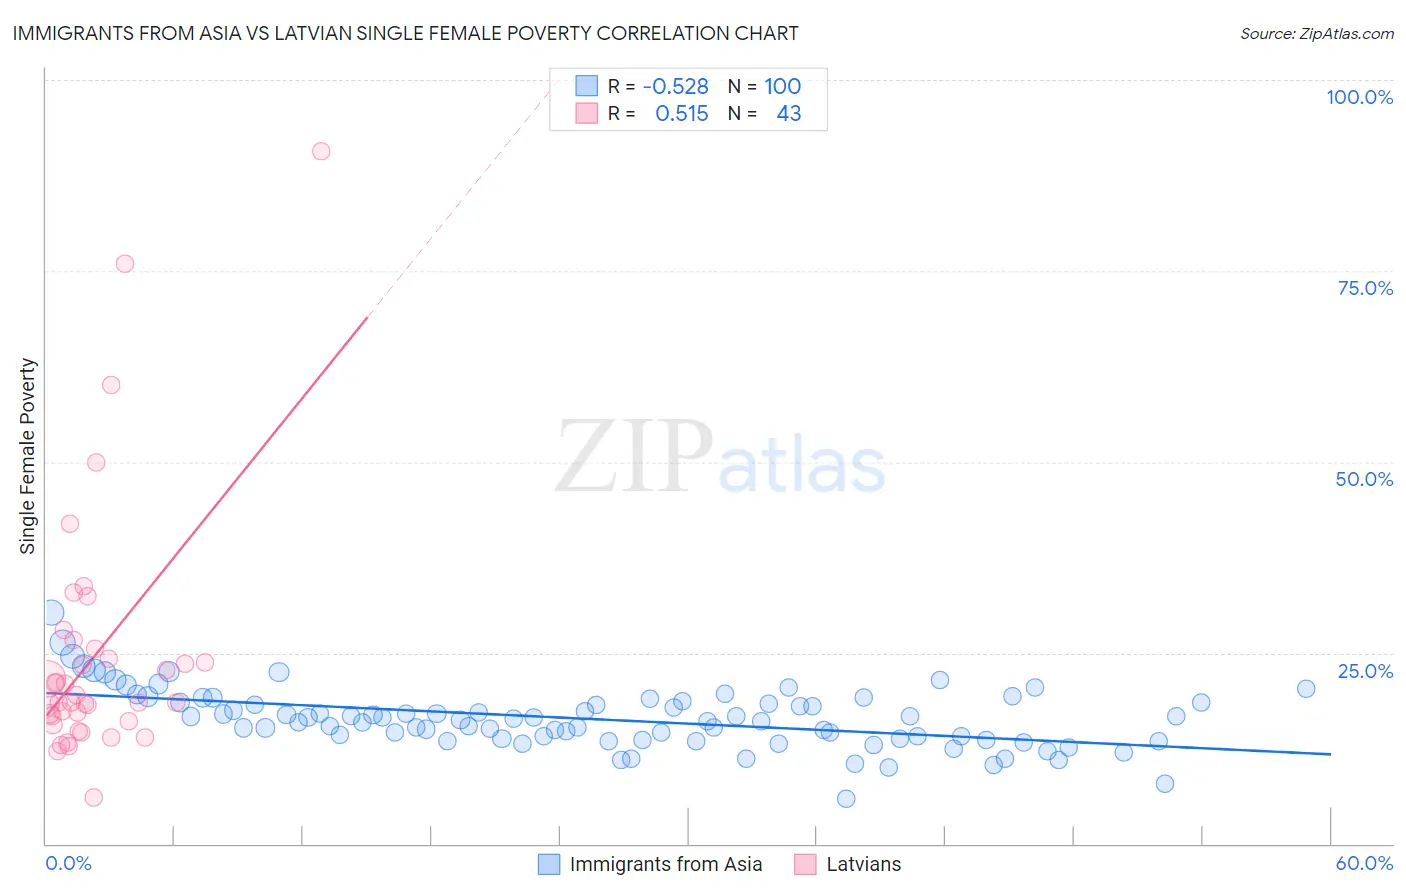
Immigrants from Asia vs Latvian Single Female Poverty Correlation Chart
The statistical analysis conducted on geographies consisting of 532,712,278 people shows a substantial negative correlation between the proportion of Immigrants from Asia and poverty level among single females in the United States with a correlation coefficient (R) of -0.528 and weighted average of 18.6%. Similarly, the statistical analysis conducted on geographies consisting of 217,777,893 people shows a substantial positive correlation between the proportion of Latvians and poverty level among single females in the United States with a correlation coefficient (R) of 0.515 and weighted average of 19.0%, a difference of 2.3%.
Single Female Poverty Correlation Summary
| Measurement | Immigrants from Asia | Latvian |
| Minimum | 5.9% | 6.0% |
| Maximum | 30.3% | 90.7% |
| Range | 24.4% | 84.7% |
| Mean | 16.3% | 24.7% |
| Median | 16.3% | 18.5% |
| Interquartile 25% (IQ1) | 13.8% | 16.0% |
| Interquartile 75% (IQ3) | 18.6% | 25.6% |
| Interquartile Range (IQR) | 4.8% | 9.5% |
| Standard Deviation (Sample) | 3.9% | 16.6% |
| Standard Deviation (Population) | 3.8% | 16.4% |
Demographics Similar to Immigrants from Asia and Latvians by Single Female Poverty
In terms of single female poverty, the demographic groups most similar to Immigrants from Asia are Immigrants from North Macedonia (18.5%, a difference of 0.050%), Immigrants from Sri Lanka (18.6%, a difference of 0.090%), Immigrants from Philippines (18.6%, a difference of 0.15%), Immigrants from Poland (18.5%, a difference of 0.21%), and Korean (18.6%, a difference of 0.33%). Similarly, the demographic groups most similar to Latvians are Macedonian (18.9%, a difference of 0.19%), Immigrants from Argentina (19.0%, a difference of 0.28%), Immigrants from Czechoslovakia (19.0%, a difference of 0.29%), Immigrants from Indonesia (18.9%, a difference of 0.35%), and Immigrants from Croatia (18.9%, a difference of 0.56%).
| Demographics | Rating | Rank | Single Female Poverty |
| Immigrants | Poland | 100.0 /100 | #29 | Exceptional 18.5% |
| Immigrants | North Macedonia | 99.9 /100 | #30 | Exceptional 18.5% |
| Immigrants | Asia | 99.9 /100 | #31 | Exceptional 18.6% |
| Immigrants | Sri Lanka | 99.9 /100 | #32 | Exceptional 18.6% |
| Immigrants | Philippines | 99.9 /100 | #33 | Exceptional 18.6% |
| Koreans | 99.9 /100 | #34 | Exceptional 18.6% |
| Immigrants | Japan | 99.9 /100 | #35 | Exceptional 18.6% |
| Turks | 99.9 /100 | #36 | Exceptional 18.7% |
| Immigrants | Armenia | 99.9 /100 | #37 | Exceptional 18.7% |
| Tongans | 99.9 /100 | #38 | Exceptional 18.8% |
| Bulgarians | 99.9 /100 | #39 | Exceptional 18.8% |
| Okinawans | 99.9 /100 | #40 | Exceptional 18.8% |
| Immigrants | Serbia | 99.9 /100 | #41 | Exceptional 18.8% |
| Jordanians | 99.9 /100 | #42 | Exceptional 18.8% |
| Immigrants | Romania | 99.9 /100 | #43 | Exceptional 18.8% |
| Immigrants | Croatia | 99.9 /100 | #44 | Exceptional 18.9% |
| Immigrants | Indonesia | 99.8 /100 | #45 | Exceptional 18.9% |
| Macedonians | 99.8 /100 | #46 | Exceptional 18.9% |
| Latvians | 99.8 /100 | #47 | Exceptional 19.0% |
| Immigrants | Argentina | 99.8 /100 | #48 | Exceptional 19.0% |
| Immigrants | Czechoslovakia | 99.8 /100 | #49 | Exceptional 19.0% |