Cambodian vs Latvian Single Female Poverty
COMPARE
Cambodian
Latvian
Single Female Poverty
Single Female Poverty Comparison
Cambodians
Latvians
19.2%
SINGLE FEMALE POVERTY
99.6/ 100
METRIC RATING
61st/ 347
METRIC RANK
19.0%
SINGLE FEMALE POVERTY
99.8/ 100
METRIC RATING
47th/ 347
METRIC RANK
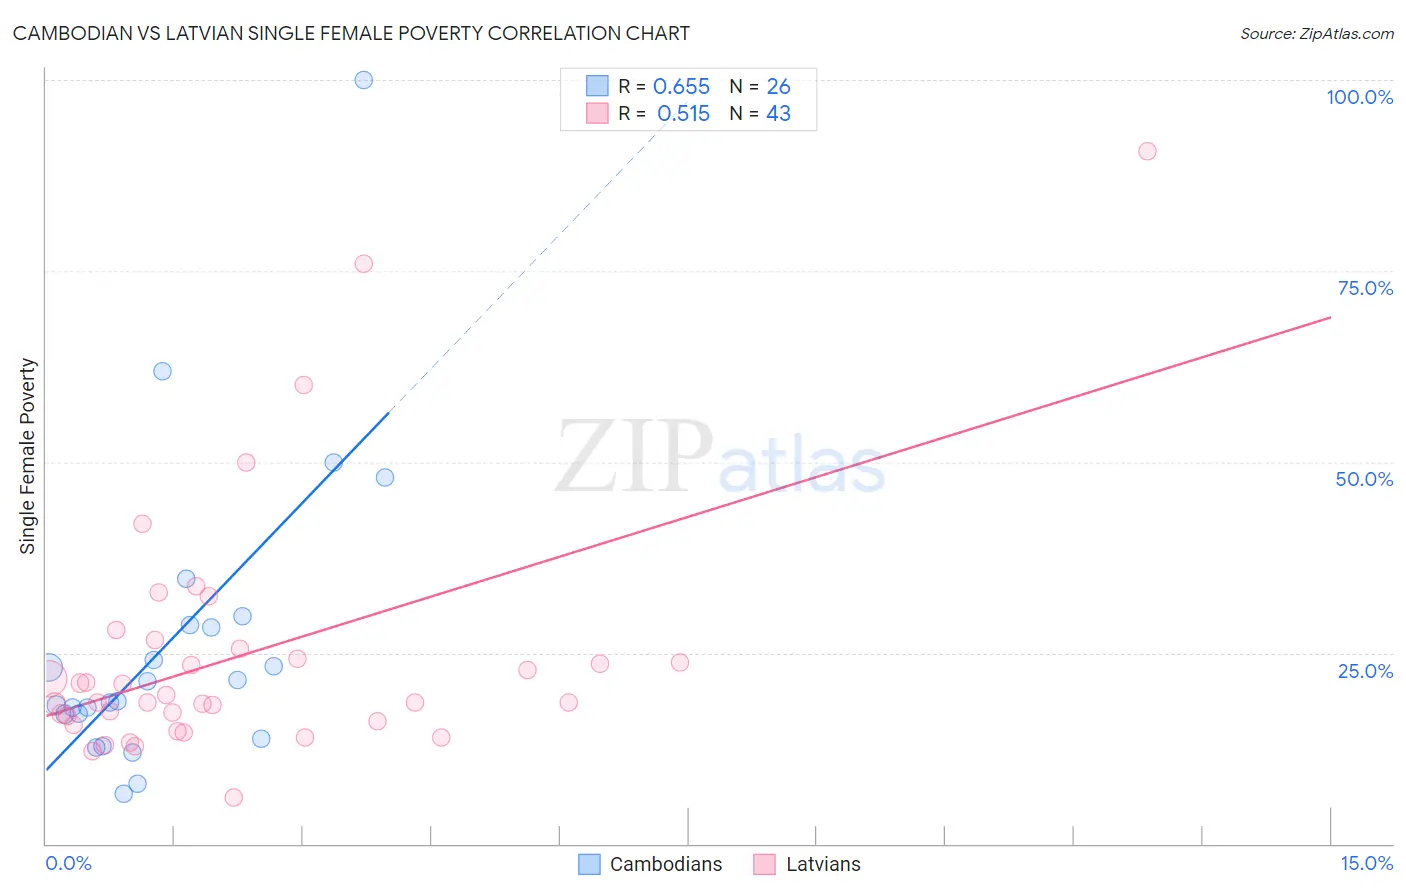
Cambodian vs Latvian Single Female Poverty Correlation Chart
The statistical analysis conducted on geographies consisting of 102,115,790 people shows a significant positive correlation between the proportion of Cambodians and poverty level among single females in the United States with a correlation coefficient (R) of 0.655 and weighted average of 19.2%. Similarly, the statistical analysis conducted on geographies consisting of 217,777,893 people shows a substantial positive correlation between the proportion of Latvians and poverty level among single females in the United States with a correlation coefficient (R) of 0.515 and weighted average of 19.0%, a difference of 1.1%.
Single Female Poverty Correlation Summary
| Measurement | Cambodian | Latvian |
| Minimum | 6.6% | 6.0% |
| Maximum | 100.0% | 90.7% |
| Range | 93.4% | 84.7% |
| Mean | 26.3% | 24.7% |
| Median | 19.9% | 18.5% |
| Interquartile 25% (IQ1) | 17.0% | 16.0% |
| Interquartile 75% (IQ3) | 28.6% | 25.6% |
| Interquartile Range (IQR) | 11.6% | 9.5% |
| Standard Deviation (Sample) | 19.9% | 16.6% |
| Standard Deviation (Population) | 19.5% | 16.4% |
Demographics Similar to Cambodians and Latvians by Single Female Poverty
In terms of single female poverty, the demographic groups most similar to Cambodians are Russian (19.2%, a difference of 0.020%), Lithuanian (19.2%, a difference of 0.050%), Sri Lankan (19.2%, a difference of 0.12%), Immigrants from Northern Europe (19.2%, a difference of 0.17%), and Immigrants from Europe (19.2%, a difference of 0.18%). Similarly, the demographic groups most similar to Latvians are Macedonian (18.9%, a difference of 0.19%), Immigrants from Argentina (19.0%, a difference of 0.28%), Immigrants from Czechoslovakia (19.0%, a difference of 0.29%), Immigrants from Eastern Europe (19.0%, a difference of 0.33%), and Immigrants from Indonesia (18.9%, a difference of 0.35%).
| Demographics | Rating | Rank | Single Female Poverty |
| Immigrants | Croatia | 99.9 /100 | #44 | Exceptional 18.9% |
| Immigrants | Indonesia | 99.8 /100 | #45 | Exceptional 18.9% |
| Macedonians | 99.8 /100 | #46 | Exceptional 18.9% |
| Latvians | 99.8 /100 | #47 | Exceptional 19.0% |
| Immigrants | Argentina | 99.8 /100 | #48 | Exceptional 19.0% |
| Immigrants | Czechoslovakia | 99.8 /100 | #49 | Exceptional 19.0% |
| Immigrants | Eastern Europe | 99.8 /100 | #50 | Exceptional 19.0% |
| Immigrants | Italy | 99.8 /100 | #51 | Exceptional 19.0% |
| Egyptians | 99.7 /100 | #52 | Exceptional 19.1% |
| Tsimshian | 99.7 /100 | #53 | Exceptional 19.1% |
| Argentineans | 99.7 /100 | #54 | Exceptional 19.1% |
| Immigrants | Vietnam | 99.7 /100 | #55 | Exceptional 19.1% |
| Immigrants | Fiji | 99.7 /100 | #56 | Exceptional 19.1% |
| Eastern Europeans | 99.7 /100 | #57 | Exceptional 19.1% |
| Immigrants | Bulgaria | 99.7 /100 | #58 | Exceptional 19.1% |
| Sri Lankans | 99.6 /100 | #59 | Exceptional 19.2% |
| Russians | 99.6 /100 | #60 | Exceptional 19.2% |
| Cambodians | 99.6 /100 | #61 | Exceptional 19.2% |
| Lithuanians | 99.6 /100 | #62 | Exceptional 19.2% |
| Immigrants | Northern Europe | 99.6 /100 | #63 | Exceptional 19.2% |
| Immigrants | Europe | 99.6 /100 | #64 | Exceptional 19.2% |