Immigrants from Syria vs Latvian Single Female Poverty
COMPARE
Immigrants from Syria
Latvian
Single Female Poverty
Single Female Poverty Comparison
Immigrants from Syria
Latvians
19.9%
SINGLE FEMALE POVERTY
96.7/ 100
METRIC RATING
107th/ 347
METRIC RANK
19.0%
SINGLE FEMALE POVERTY
99.8/ 100
METRIC RATING
47th/ 347
METRIC RANK
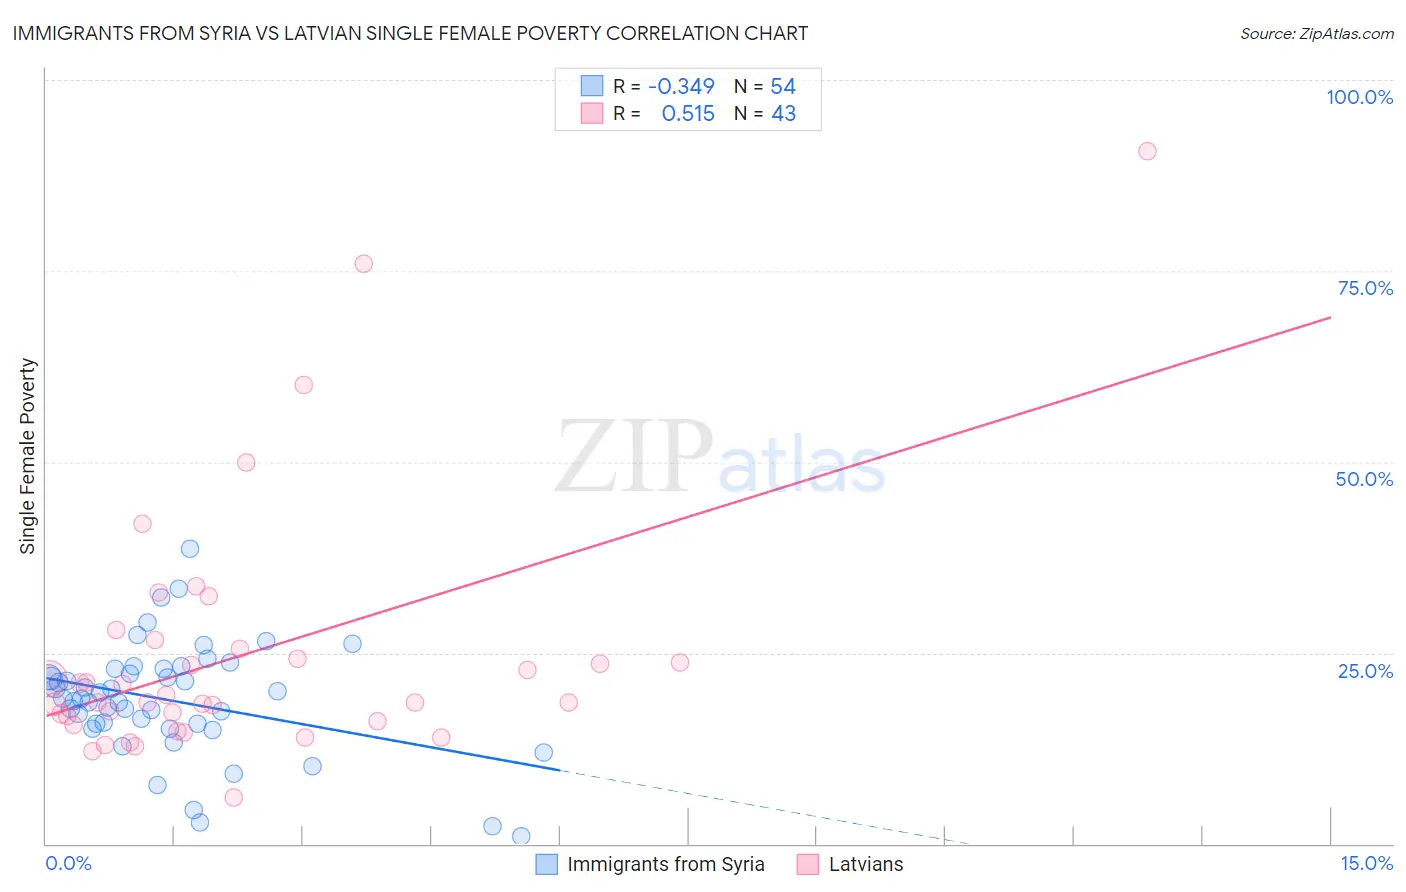
Immigrants from Syria vs Latvian Single Female Poverty Correlation Chart
The statistical analysis conducted on geographies consisting of 173,058,161 people shows a mild negative correlation between the proportion of Immigrants from Syria and poverty level among single females in the United States with a correlation coefficient (R) of -0.349 and weighted average of 19.9%. Similarly, the statistical analysis conducted on geographies consisting of 217,777,893 people shows a substantial positive correlation between the proportion of Latvians and poverty level among single females in the United States with a correlation coefficient (R) of 0.515 and weighted average of 19.0%, a difference of 4.9%.
Single Female Poverty Correlation Summary
| Measurement | Immigrants from Syria | Latvian |
| Minimum | 0.97% | 6.0% |
| Maximum | 38.6% | 90.7% |
| Range | 37.6% | 84.7% |
| Mean | 18.8% | 24.7% |
| Median | 19.0% | 18.5% |
| Interquartile 25% (IQ1) | 15.8% | 16.0% |
| Interquartile 75% (IQ3) | 22.9% | 25.6% |
| Interquartile Range (IQR) | 7.1% | 9.5% |
| Standard Deviation (Sample) | 7.4% | 16.6% |
| Standard Deviation (Population) | 7.3% | 16.4% |
Similar Demographics by Single Female Poverty
Demographics Similar to Immigrants from Syria by Single Female Poverty
In terms of single female poverty, the demographic groups most similar to Immigrants from Syria are Ethiopian (19.9%, a difference of 0.020%), Native Hawaiian (19.9%, a difference of 0.050%), Colombian (19.9%, a difference of 0.060%), Immigrants from Western Asia (19.9%, a difference of 0.070%), and Israeli (19.9%, a difference of 0.11%).
| Demographics | Rating | Rank | Single Female Poverty |
| Ukrainians | 97.6 /100 | #100 | Exceptional 19.8% |
| Immigrants | Belgium | 97.3 /100 | #101 | Exceptional 19.8% |
| Immigrants | Cameroon | 97.3 /100 | #102 | Exceptional 19.8% |
| Immigrants | Southern Europe | 97.1 /100 | #103 | Exceptional 19.9% |
| Chileans | 96.9 /100 | #104 | Exceptional 19.9% |
| Israelis | 96.9 /100 | #105 | Exceptional 19.9% |
| Ethiopians | 96.7 /100 | #106 | Exceptional 19.9% |
| Immigrants | Syria | 96.7 /100 | #107 | Exceptional 19.9% |
| Native Hawaiians | 96.6 /100 | #108 | Exceptional 19.9% |
| Colombians | 96.6 /100 | #109 | Exceptional 19.9% |
| Immigrants | Western Asia | 96.5 /100 | #110 | Exceptional 19.9% |
| Carpatho Rusyns | 96.1 /100 | #111 | Exceptional 20.0% |
| Immigrants | Netherlands | 96.0 /100 | #112 | Exceptional 20.0% |
| Immigrants | Zimbabwe | 95.9 /100 | #113 | Exceptional 20.0% |
| Immigrants | Colombia | 95.9 /100 | #114 | Exceptional 20.0% |
Demographics Similar to Latvians by Single Female Poverty
In terms of single female poverty, the demographic groups most similar to Latvians are Macedonian (18.9%, a difference of 0.19%), Immigrants from Argentina (19.0%, a difference of 0.28%), Immigrants from Czechoslovakia (19.0%, a difference of 0.29%), Immigrants from Eastern Europe (19.0%, a difference of 0.33%), and Immigrants from Indonesia (18.9%, a difference of 0.35%).
| Demographics | Rating | Rank | Single Female Poverty |
| Okinawans | 99.9 /100 | #40 | Exceptional 18.8% |
| Immigrants | Serbia | 99.9 /100 | #41 | Exceptional 18.8% |
| Jordanians | 99.9 /100 | #42 | Exceptional 18.8% |
| Immigrants | Romania | 99.9 /100 | #43 | Exceptional 18.8% |
| Immigrants | Croatia | 99.9 /100 | #44 | Exceptional 18.9% |
| Immigrants | Indonesia | 99.8 /100 | #45 | Exceptional 18.9% |
| Macedonians | 99.8 /100 | #46 | Exceptional 18.9% |
| Latvians | 99.8 /100 | #47 | Exceptional 19.0% |
| Immigrants | Argentina | 99.8 /100 | #48 | Exceptional 19.0% |
| Immigrants | Czechoslovakia | 99.8 /100 | #49 | Exceptional 19.0% |
| Immigrants | Eastern Europe | 99.8 /100 | #50 | Exceptional 19.0% |
| Immigrants | Italy | 99.8 /100 | #51 | Exceptional 19.0% |
| Egyptians | 99.7 /100 | #52 | Exceptional 19.1% |
| Tsimshian | 99.7 /100 | #53 | Exceptional 19.1% |
| Argentineans | 99.7 /100 | #54 | Exceptional 19.1% |