Kenyan vs Cypriot Median Female Earnings
COMPARE
Kenyan
Cypriot
Median Female Earnings
Median Female Earnings Comparison
Kenyans
Cypriots
$39,860
MEDIAN FEMALE EARNINGS
58.4/ 100
METRIC RATING
169th/ 347
METRIC RANK
$45,570
MEDIAN FEMALE EARNINGS
100.0/ 100
METRIC RATING
18th/ 347
METRIC RANK
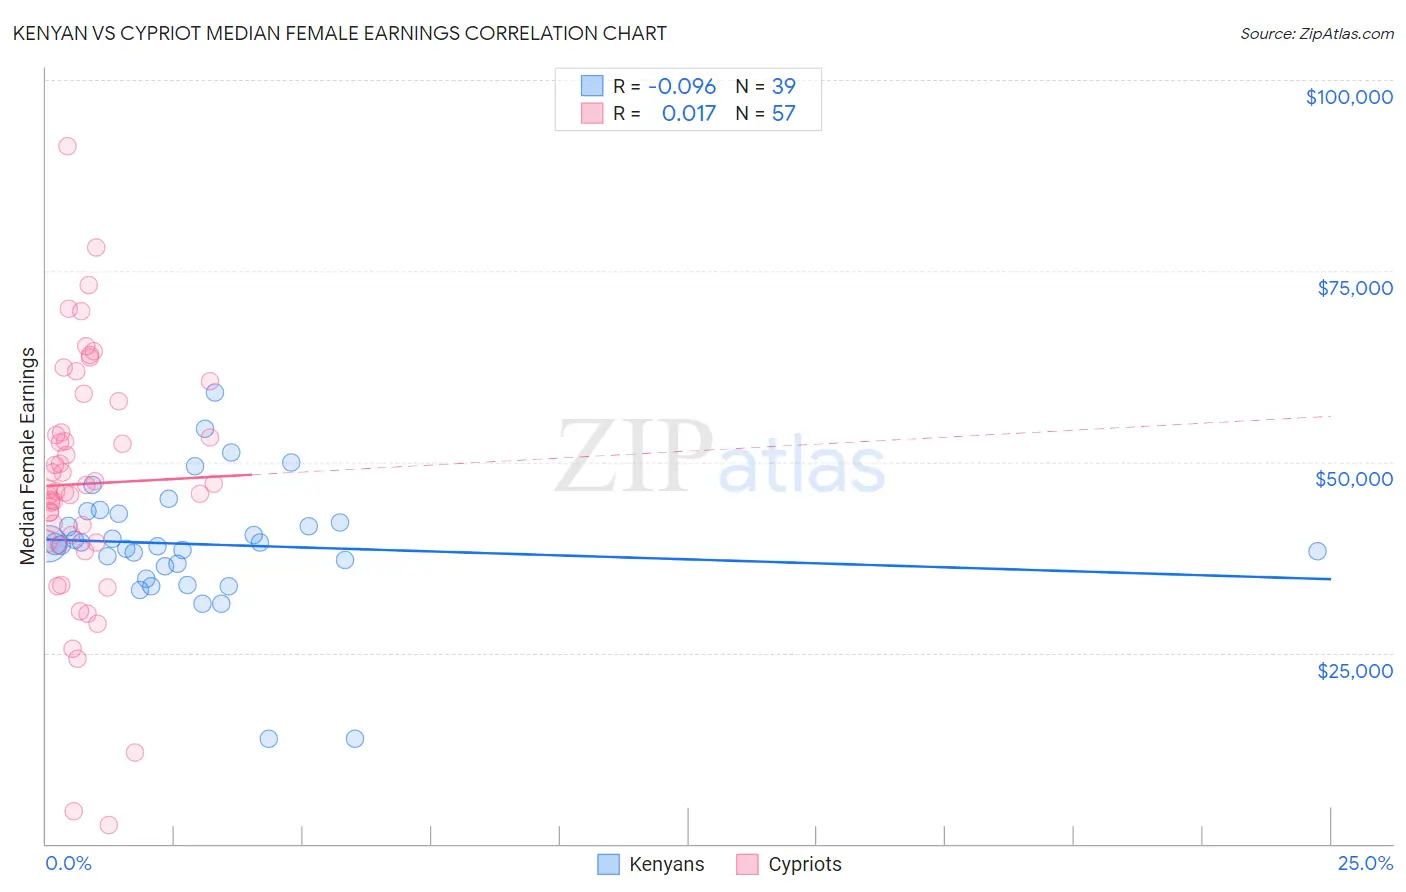
Kenyan vs Cypriot Median Female Earnings Correlation Chart
The statistical analysis conducted on geographies consisting of 168,237,877 people shows a slight negative correlation between the proportion of Kenyans and median female earnings in the United States with a correlation coefficient (R) of -0.096 and weighted average of $39,860. Similarly, the statistical analysis conducted on geographies consisting of 61,860,618 people shows no correlation between the proportion of Cypriots and median female earnings in the United States with a correlation coefficient (R) of 0.017 and weighted average of $45,570, a difference of 14.3%.
Median Female Earnings Correlation Summary
| Measurement | Kenyan | Cypriot |
| Minimum | $13,750 | $2,499 |
| Maximum | $59,125 | $91,382 |
| Range | $45,375 | $88,883 |
| Mean | $39,183 | $47,121 |
| Median | $39,212 | $46,430 |
| Interquartile 25% (IQ1) | $36,279 | $39,556 |
| Interquartile 75% (IQ3) | $43,131 | $55,932 |
| Interquartile Range (IQR) | $6,851 | $16,376 |
| Standard Deviation (Sample) | $8,498 | $16,285 |
| Standard Deviation (Population) | $8,388 | $16,141 |
Similar Demographics by Median Female Earnings
Demographics Similar to Kenyans by Median Female Earnings
In terms of median female earnings, the demographic groups most similar to Kenyans are Immigrants from Peru ($39,871, a difference of 0.030%), Immigrants from Ghana ($39,894, a difference of 0.080%), Luxembourger ($39,891, a difference of 0.080%), Slovene ($39,817, a difference of 0.11%), and Immigrants from Bangladesh ($39,910, a difference of 0.12%).
| Demographics | Rating | Rank | Median Female Earnings |
| South American Indians | 66.1 /100 | #162 | Good $40,019 |
| Lebanese | 65.5 /100 | #163 | Good $40,006 |
| Immigrants | Saudi Arabia | 62.9 /100 | #164 | Good $39,952 |
| Immigrants | Bangladesh | 60.8 /100 | #165 | Good $39,910 |
| Immigrants | Ghana | 60.0 /100 | #166 | Good $39,894 |
| Luxembourgers | 59.9 /100 | #167 | Average $39,891 |
| Immigrants | Peru | 58.9 /100 | #168 | Average $39,871 |
| Kenyans | 58.4 /100 | #169 | Average $39,860 |
| Slovenes | 56.2 /100 | #170 | Average $39,817 |
| Immigrants | Portugal | 54.7 /100 | #171 | Average $39,788 |
| British | 53.8 /100 | #172 | Average $39,772 |
| Canadians | 51.4 /100 | #173 | Average $39,724 |
| South Americans | 50.0 /100 | #174 | Average $39,698 |
| Immigrants | South America | 47.2 /100 | #175 | Average $39,643 |
| Nigerians | 47.0 /100 | #176 | Average $39,641 |
Demographics Similar to Cypriots by Median Female Earnings
In terms of median female earnings, the demographic groups most similar to Cypriots are Eastern European ($45,385, a difference of 0.41%), Immigrants from Japan ($45,323, a difference of 0.55%), Cambodian ($45,014, a difference of 1.2%), Immigrants from Greece ($44,976, a difference of 1.3%), and Burmese ($44,911, a difference of 1.5%).
| Demographics | Rating | Rank | Median Female Earnings |
| Okinawans | 100.0 /100 | #11 | Exceptional $46,905 |
| Immigrants | Israel | 100.0 /100 | #12 | Exceptional $46,902 |
| Immigrants | Australia | 100.0 /100 | #13 | Exceptional $46,573 |
| Soviet Union | 100.0 /100 | #14 | Exceptional $46,556 |
| Immigrants | Eastern Asia | 100.0 /100 | #15 | Exceptional $46,502 |
| Indians (Asian) | 100.0 /100 | #16 | Exceptional $46,481 |
| Immigrants | South Central Asia | 100.0 /100 | #17 | Exceptional $46,324 |
| Cypriots | 100.0 /100 | #18 | Exceptional $45,570 |
| Eastern Europeans | 100.0 /100 | #19 | Exceptional $45,385 |
| Immigrants | Japan | 100.0 /100 | #20 | Exceptional $45,323 |
| Cambodians | 100.0 /100 | #21 | Exceptional $45,014 |
| Immigrants | Greece | 100.0 /100 | #22 | Exceptional $44,976 |
| Burmese | 100.0 /100 | #23 | Exceptional $44,911 |
| Immigrants | Korea | 100.0 /100 | #24 | Exceptional $44,847 |
| Immigrants | Sweden | 100.0 /100 | #25 | Exceptional $44,774 |