Kenyan vs Cypriot Master's Degree

COMPARE

Kenyan
Race
Ancestry
AfghanAfricanAlaska NativeAlaskan AthabascanAlbanianAleutAlsatianAmericanApacheArabArapahoArgentineanArmenianAssyrian/Chaldean/SyriacAustralianAustrianBahamianBangladeshiBarbadianBasqueBelgianBelizeanBermudanBhutaneseBlackfeetBolivianBrazilianBritishBritish West IndianBulgarianBurmeseCajunCambodianCanadianCape VerdeanCarpatho RusynCelticCentral AmericanCentral American IndianCherokeeCheyenneChickasawChileanChineseChippewaChoctawColombianColvilleComancheCosta RicanCreeCreekCroatianCrowCubanCzechCzechoslovakianDanishDelawareDominicanDutchDutch West IndianEastern EuropeanEcuadorianEgyptianEnglishEstonianEthiopianEuropeanFijianFilipinoFinnishFrenchFrench American IndianFrench CanadianGermanGerman RussianGhanaianGreekGuamanian/ChamorroGuatemalanGuyaneseHaitianHmongHonduranHopiHoumaHungarianIcelanderIndian (Asian)IndonesianInupiatIranianIraqiIrishIroquoisIsraeliItalianJamaicanJapaneseJordanianKenyanKiowaKoreanLaotianLatvianLebaneseLiberianLithuanianLumbeeLuxembourgerMacedonianMalaysianMalteseMarshalleseMenomineeMexicanMexican American IndianMongolianMoroccanNative HawaiianNavajoNepaleseNew ZealanderNicaraguanNigerianNorthern EuropeanNorwegianOkinawanOsageOttawaPaiutePakistaniPalestinianPanamanianParaguayanPennsylvania GermanPeruvianPimaPolishPortuguesePotawatomiPuebloPuerto RicanPuget Sound SalishRomanianRussianSalvadoranSamoanScandinavianScotch-IrishScottishSeminoleSenegaleseSerbianShoshoneSierra LeoneanSiouxSlavicSlovakSloveneSomaliSouth AfricanSouth AmericanSouth American IndianSoviet UnionSpaniardSpanishSpanish AmericanSpanish American IndianSri LankanSubsaharan AfricanSudaneseSwedishSwissSyrianTaiwaneseThaiTlingit-HaidaTohono O'OdhamTonganTrinidadian and TobagonianTsimshianTurkishU.S. Virgin IslanderUgandanUkrainianUruguayanUteVenezuelanVietnameseWelshWest IndianYakamaYaquiYugoslavianYumanYup'ikZimbabwean
Immigration
NonimmigrantsImmigrantsAfghanistanAfricaAlbaniaArgentinaArmeniaAsiaAustraliaAustriaBahamasBangladeshBarbadosBelarusBelgiumBelizeBoliviaBosnia and HerzegovinaBrazilBulgariaBurma/MyanmarCabo VerdeCambodiaCameroonCanadaCaribbeanCentral AmericaChileChinaColombiaCongoCosta RicaCroatiaCubaCzechoslovakiaDenmarkDominicaDominican RepublicEastern AfricaEastern AsiaEastern EuropeEcuadorEgyptEl SalvadorEnglandEritreaEthiopiaEuropeFijiFranceGermanyGhanaGreeceGrenadaGuatemalaGuyanaHaitiHondurasHong KongHungaryIndiaIndonesiaIranIraqIrelandIsraelItalyJamaicaJapanJordanKazakhstanKenyaKoreaKuwaitLaosLatin AmericaLatviaLebanonLiberiaLithuaniaMalaysiaMexicoMicronesiaMiddle AfricaMoldovaMoroccoNepalNetherlandsNicaraguaNigeriaNorth AmericaNorth MacedoniaNorthern AfricaNorthern EuropeNorwayOceaniaPakistanPanamaPeruPhilippinesPolandPortugalRomaniaRussiaSaudi ArabiaScotlandSenegalSerbiaSierra LeoneSingaporeSomaliaSouth AfricaSouth AmericaSouth Central AsiaSouth Eastern AsiaSouthern EuropeSpainSri LankaSt. Vincent and the GrenadinesSudanSwedenSwitzerlandSyriaTaiwanThailandTrinidad and TobagoTurkeyUgandaUkraineUruguayUzbekistanVenezuelaVietnamWest IndiesWestern AfricaWestern AsiaWestern EuropeYemenZaireZimbabweAzores
Cypriot
Race
Ancestry
AfghanAfricanAlaska NativeAlaskan AthabascanAlbanianAleutAlsatianAmericanApacheArabArapahoArgentineanArmenianAssyrian/Chaldean/SyriacAustralianAustrianBahamianBangladeshiBarbadianBasqueBelgianBelizeanBermudanBhutaneseBlackfeetBolivianBrazilianBritishBritish West IndianBulgarianBurmeseCajunCambodianCanadianCape VerdeanCarpatho RusynCelticCentral AmericanCentral American IndianCherokeeCheyenneChickasawChileanChineseChippewaChoctawColombianColvilleComancheCosta RicanCreeCreekCroatianCrowCubanCypriotCzechCzechoslovakianDanishDelawareDominicanDutchDutch West IndianEastern EuropeanEcuadorianEgyptianEnglishEstonianEthiopianEuropeanFijianFilipinoFinnishFrenchFrench American IndianFrench CanadianGermanGerman RussianGhanaianGreekGuamanian/ChamorroGuatemalanGuyaneseHaitianHmongHonduranHopiHoumaHungarianIcelanderIndian (Asian)IndonesianInupiatIranianIraqiIrishIroquoisIsraeliItalianJamaicanJapaneseJordanianKiowaKoreanLaotianLatvianLebaneseLiberianLithuanianLumbeeLuxembourgerMacedonianMalaysianMalteseMarshalleseMenomineeMexicanMexican American IndianMongolianMoroccanNative HawaiianNavajoNepaleseNew ZealanderNicaraguanNigerianNorthern EuropeanNorwegianOkinawanOsageOttawaPaiutePakistaniPalestinianPanamanianParaguayanPennsylvania GermanPeruvianPimaPolishPortuguesePotawatomiPuebloPuerto RicanPuget Sound SalishRomanianRussianSalvadoranSamoanScandinavianScotch-IrishScottishSeminoleSenegaleseSerbianShoshoneSierra LeoneanSiouxSlavicSlovakSloveneSomaliSouth AfricanSouth AmericanSouth American IndianSoviet UnionSpaniardSpanishSpanish AmericanSpanish American IndianSri LankanSubsaharan AfricanSudaneseSwedishSwissSyrianTaiwaneseThaiTlingit-HaidaTohono O'OdhamTonganTrinidadian and TobagonianTsimshianTurkishU.S. Virgin IslanderUgandanUkrainianUruguayanUteVenezuelanVietnameseWelshWest IndianYakamaYaquiYugoslavianYumanYup'ikZimbabwean
Immigration
NonimmigrantsImmigrantsAfghanistanAfricaAlbaniaArgentinaArmeniaAsiaAustraliaAustriaBahamasBangladeshBarbadosBelarusBelgiumBelizeBoliviaBosnia and HerzegovinaBrazilBulgariaBurma/MyanmarCabo VerdeCambodiaCameroonCanadaCaribbeanCentral AmericaChileChinaColombiaCongoCosta RicaCroatiaCubaCzechoslovakiaDenmarkDominicaDominican RepublicEastern AfricaEastern AsiaEastern EuropeEcuadorEgyptEl SalvadorEnglandEritreaEthiopiaEuropeFijiFranceGermanyGhanaGreeceGrenadaGuatemalaGuyanaHaitiHondurasHong KongHungaryIndiaIndonesiaIranIraqIrelandIsraelItalyJamaicaJapanJordanKazakhstanKenyaKoreaKuwaitLaosLatin AmericaLatviaLebanonLiberiaLithuaniaMalaysiaMexicoMicronesiaMiddle AfricaMoldovaMoroccoNepalNetherlandsNicaraguaNigeriaNorth AmericaNorth MacedoniaNorthern AfricaNorthern EuropeNorwayOceaniaPakistanPanamaPeruPhilippinesPolandPortugalRomaniaRussiaSaudi ArabiaScotlandSenegalSerbiaSierra LeoneSingaporeSomaliaSouth AfricaSouth AmericaSouth Central AsiaSouth Eastern AsiaSouthern EuropeSpainSri LankaSt. Vincent and the GrenadinesSudanSwedenSwitzerlandSyriaTaiwanThailandTrinidad and TobagoTurkeyUgandaUkraineUruguayUzbekistanVenezuelaVietnamWest IndiesWestern AfricaWestern AsiaWestern EuropeYemenZaireZimbabweAzores
Master's Degree
Income
Poverty
Unemployment
Labor Participation
Family Structure
Vehicle Availability
Education Level
Disability

Master's Degree Comparison

Kenyans

Cypriots

Good
Exceptional
15.3%
MASTER'S DEGREE
70.3/ 100
METRIC RATING
160th/ 347
METRIC RANK
21.8%
MASTER'S DEGREE
100.0/ 100
METRIC RATING
8th/ 347
METRIC RANK

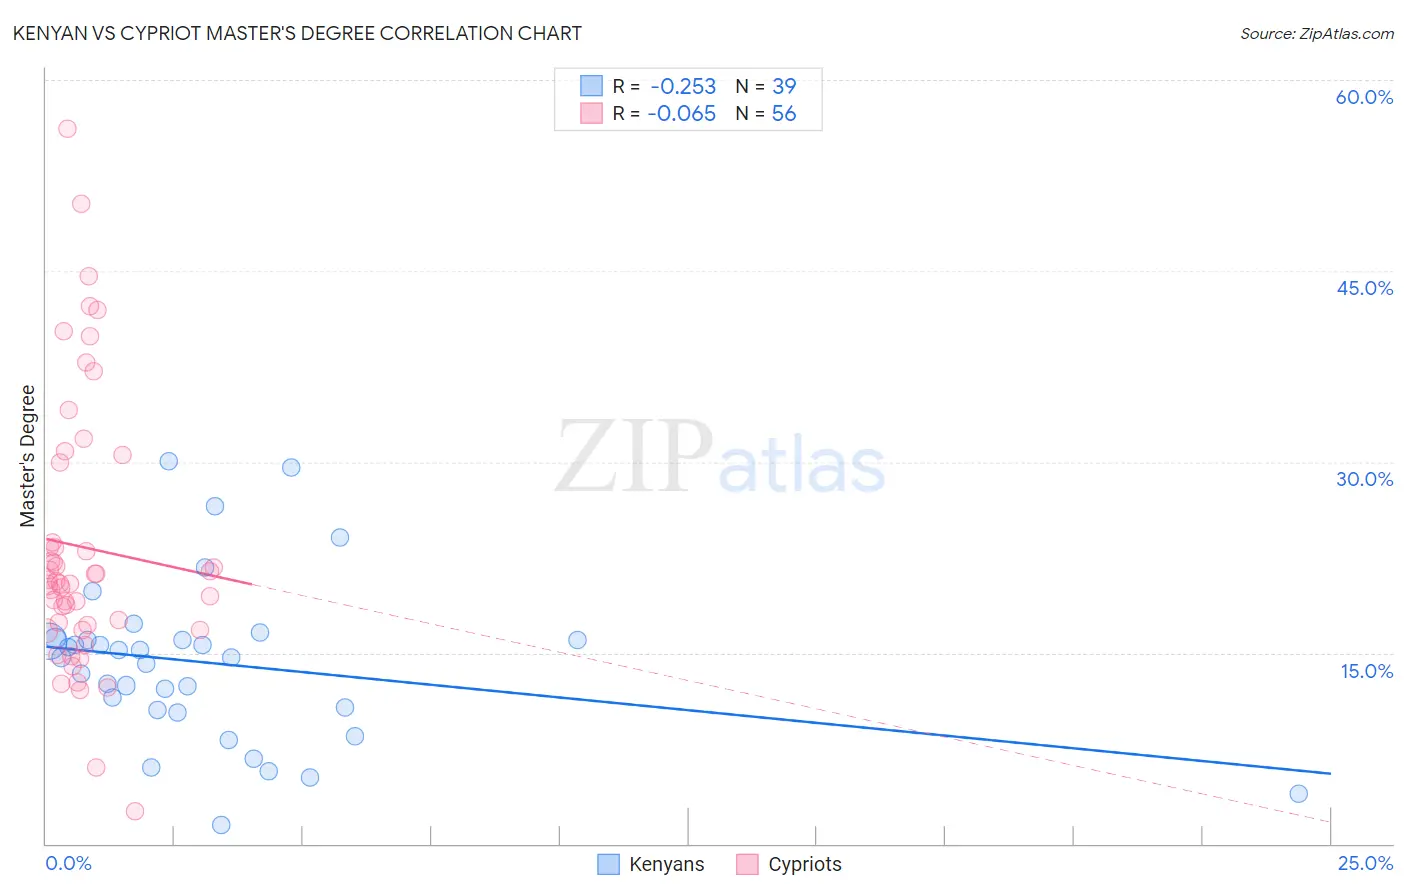
Kenyan vs Cypriot Master's Degree Correlation Chart

The statistical analysis conducted on geographies consisting of 168,212,419 people shows a weak negative correlation between the proportion of Kenyans and percentage of population with at least master's degree education in the United States with a correlation coefficient (R) of -0.253 and weighted average of 15.3%. Similarly, the statistical analysis conducted on geographies consisting of 61,862,826 people shows a slight negative correlation between the proportion of Cypriots and percentage of population with at least master's degree education in the United States with a correlation coefficient (R) of -0.065 and weighted average of 21.8%, a difference of 42.1%.
Kenyan vs Cypriot Master's Degree

Master's Degree Correlation Summary

MeasurementKenyanCypriot
Minimum1.5%2.5%
Maximum30.0%56.1%
Range28.5%53.6%
Mean14.2%23.3%
Median14.6%20.5%
Interquartile 25% (IQ1)10.5%17.0%
Interquartile 75% (IQ3)16.0%26.8%
Interquartile Range (IQR)5.6%9.8%
Standard Deviation (Sample)6.4%10.7%
Standard Deviation (Population)6.3%10.6%

Similar Demographics by Master's Degree

Demographics Similar to Kenyans by Master's Degree

In terms of master's degree, the demographic groups most similar to Kenyans are Luxembourger (15.3%, a difference of 0.11%), Immigrants from Poland (15.4%, a difference of 0.18%), Immigrants from Cameroon (15.4%, a difference of 0.22%), Sudanese (15.3%, a difference of 0.23%), and Peruvian (15.3%, a difference of 0.24%).
DemographicsRating | RankMaster's Degree
Icelanders
76.8
/100
|
#153
Good
15.5%
Immigrants | South America
76.3
/100
|
#154
Good
15.5%
Immigrants | Bangladesh
76.1
/100
|
#155
Good
15.5%
Bermudans
73.9
/100
|
#156
Good
15.4%
Immigrants | Cameroon
71.7
/100
|
#157
Good
15.4%
Immigrants | Poland
71.5
/100
|
#158
Good
15.4%
Luxembourgers
71.0
/100
|
#159
Good
15.3%
Kenyans
70.3
/100
|
#160
Good
15.3%
Sudanese
68.7
/100
|
#161
Good
15.3%
Peruvians
68.7
/100
|
#162
Good
15.3%
Uruguayans
67.1
/100
|
#163
Good
15.3%
Colombians
66.9
/100
|
#164
Good
15.3%
Immigrants | Kenya
66.6
/100
|
#165
Good
15.3%
Swedes
66.1
/100
|
#166
Good
15.2%
Senegalese
65.6
/100
|
#167
Good
15.2%

Demographics Similar to Cypriots by Master's Degree

In terms of master's degree, the demographic groups most similar to Cypriots are Thai (21.7%, a difference of 0.34%), Immigrants from Iran (21.6%, a difference of 0.75%), Iranian (22.3%, a difference of 2.2%), Immigrants from India (22.3%, a difference of 2.4%), and Immigrants from China (21.2%, a difference of 2.9%).
DemographicsRating | RankMaster's Degree
Immigrants | Singapore
100.0
/100
|
#1
Exceptional
23.4%
Filipinos
100.0
/100
|
#2
Exceptional
23.4%
Immigrants | Israel
100.0
/100
|
#3
Exceptional
22.6%
Okinawans
100.0
/100
|
#4
Exceptional
22.6%
Immigrants | Taiwan
100.0
/100
|
#5
Exceptional
22.5%
Immigrants | India
100.0
/100
|
#6
Exceptional
22.3%
Iranians
100.0
/100
|
#7
Exceptional
22.3%
Cypriots
100.0
/100
|
#8
Exceptional
21.8%
Thais
100.0
/100
|
#9
Exceptional
21.7%
Immigrants | Iran
100.0
/100
|
#10
Exceptional
21.6%
Immigrants | China
100.0
/100
|
#11
Exceptional
21.2%
Eastern Europeans
100.0
/100
|
#12
Exceptional
21.1%
Immigrants | Australia
100.0
/100
|
#13
Exceptional
20.9%
Immigrants | Switzerland
100.0
/100
|
#14
Exceptional
20.9%
Immigrants | Eastern Asia
100.0
/100
|
#15
Exceptional
20.8%