Jamaican vs Tohono O'odham Poverty
COMPARE
Jamaican
Tohono O'odham
Poverty
Poverty Comparison
Jamaicans
Tohono O'odham
14.4%
POVERTY
0.1/ 100
METRIC RATING
263rd/ 347
METRIC RANK
24.4%
POVERTY
0.0/ 100
METRIC RATING
347th/ 347
METRIC RANK
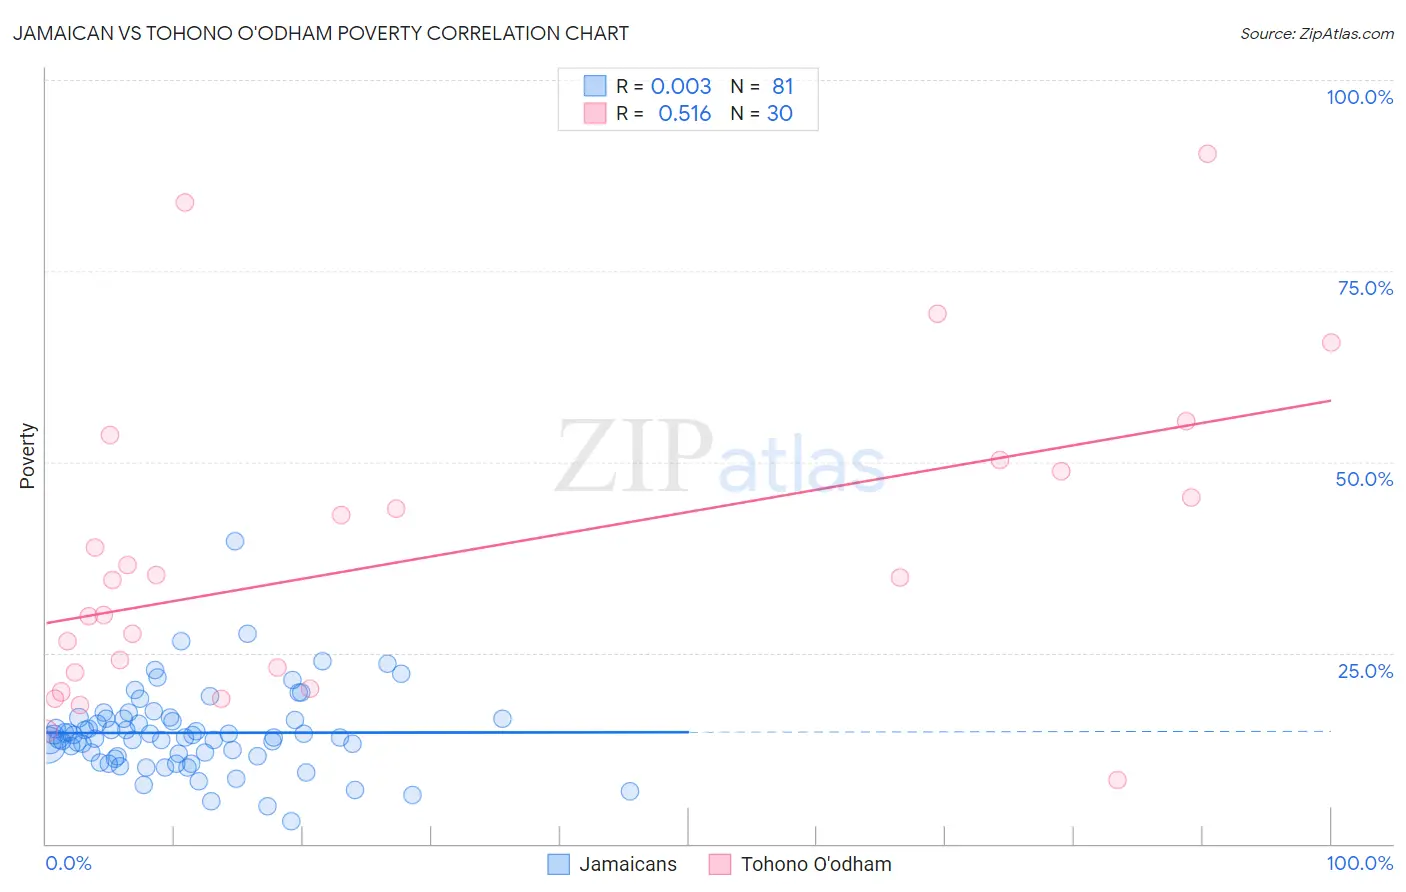
Jamaican vs Tohono O'odham Poverty Correlation Chart
The statistical analysis conducted on geographies consisting of 367,709,935 people shows no correlation between the proportion of Jamaicans and poverty level in the United States with a correlation coefficient (R) of 0.003 and weighted average of 14.4%. Similarly, the statistical analysis conducted on geographies consisting of 58,718,506 people shows a substantial positive correlation between the proportion of Tohono O'odham and poverty level in the United States with a correlation coefficient (R) of 0.516 and weighted average of 24.4%, a difference of 69.1%.
Poverty Correlation Summary
| Measurement | Jamaican | Tohono O'odham |
| Minimum | 2.9% | 8.3% |
| Maximum | 39.6% | 90.4% |
| Range | 36.7% | 82.0% |
| Mean | 14.5% | 37.7% |
| Median | 13.9% | 34.7% |
| Interquartile 25% (IQ1) | 11.5% | 22.4% |
| Interquartile 75% (IQ3) | 16.4% | 48.7% |
| Interquartile Range (IQR) | 4.9% | 26.3% |
| Standard Deviation (Sample) | 5.4% | 20.1% |
| Standard Deviation (Population) | 5.4% | 19.8% |
Similar Demographics by Poverty
Demographics Similar to Jamaicans by Poverty
In terms of poverty, the demographic groups most similar to Jamaicans are Immigrants from Jamaica (14.4%, a difference of 0.090%), Immigrants from Guyana (14.5%, a difference of 0.21%), Immigrants from Liberia (14.4%, a difference of 0.35%), Guyanese (14.5%, a difference of 0.38%), and Cherokee (14.4%, a difference of 0.51%).
| Demographics | Rating | Rank | Poverty |
| Mexican American Indians | 0.1 /100 | #256 | Tragic 14.3% |
| Trinidadians and Tobagonians | 0.1 /100 | #257 | Tragic 14.3% |
| Ottawa | 0.1 /100 | #258 | Tragic 14.3% |
| Immigrants | Nicaragua | 0.1 /100 | #259 | Tragic 14.3% |
| Cape Verdeans | 0.1 /100 | #260 | Tragic 14.4% |
| Cherokee | 0.1 /100 | #261 | Tragic 14.4% |
| Immigrants | Liberia | 0.1 /100 | #262 | Tragic 14.4% |
| Jamaicans | 0.1 /100 | #263 | Tragic 14.4% |
| Immigrants | Jamaica | 0.1 /100 | #264 | Tragic 14.4% |
| Immigrants | Guyana | 0.1 /100 | #265 | Tragic 14.5% |
| Guyanese | 0.1 /100 | #266 | Tragic 14.5% |
| Iroquois | 0.1 /100 | #267 | Tragic 14.5% |
| Sub-Saharan Africans | 0.1 /100 | #268 | Tragic 14.5% |
| Immigrants | Cuba | 0.1 /100 | #269 | Tragic 14.6% |
| Central Americans | 0.1 /100 | #270 | Tragic 14.6% |
Demographics Similar to Tohono O'odham by Poverty
In terms of poverty, the demographic groups most similar to Tohono O'odham are Puerto Rican (23.7%, a difference of 3.1%), Navajo (23.1%, a difference of 5.7%), Lumbee (21.9%, a difference of 11.3%), Pima (21.9%, a difference of 11.6%), and Immigrants from Yemen (21.5%, a difference of 13.4%).
| Demographics | Rating | Rank | Poverty |
| Houma | 0.0 /100 | #333 | Tragic 18.4% |
| Apache | 0.0 /100 | #334 | Tragic 18.4% |
| Cheyenne | 0.0 /100 | #335 | Tragic 18.9% |
| Pueblo | 0.0 /100 | #336 | Tragic 19.4% |
| Sioux | 0.0 /100 | #337 | Tragic 19.8% |
| Yuman | 0.0 /100 | #338 | Tragic 20.2% |
| Crow | 0.0 /100 | #339 | Tragic 20.7% |
| Yup'ik | 0.0 /100 | #340 | Tragic 20.8% |
| Hopi | 0.0 /100 | #341 | Tragic 20.8% |
| Immigrants | Yemen | 0.0 /100 | #342 | Tragic 21.5% |
| Pima | 0.0 /100 | #343 | Tragic 21.9% |
| Lumbee | 0.0 /100 | #344 | Tragic 21.9% |
| Navajo | 0.0 /100 | #345 | Tragic 23.1% |
| Puerto Ricans | 0.0 /100 | #346 | Tragic 23.7% |
| Tohono O'odham | 0.0 /100 | #347 | Tragic 24.4% |