Immigrants from Eastern Asia vs Tohono O'odham Poverty
COMPARE
Immigrants from Eastern Asia
Tohono O'odham
Poverty
Poverty Comparison
Immigrants from Eastern Asia
Tohono O'odham
11.3%
POVERTY
96.7/ 100
METRIC RATING
77th/ 347
METRIC RANK
24.4%
POVERTY
0.0/ 100
METRIC RATING
347th/ 347
METRIC RANK
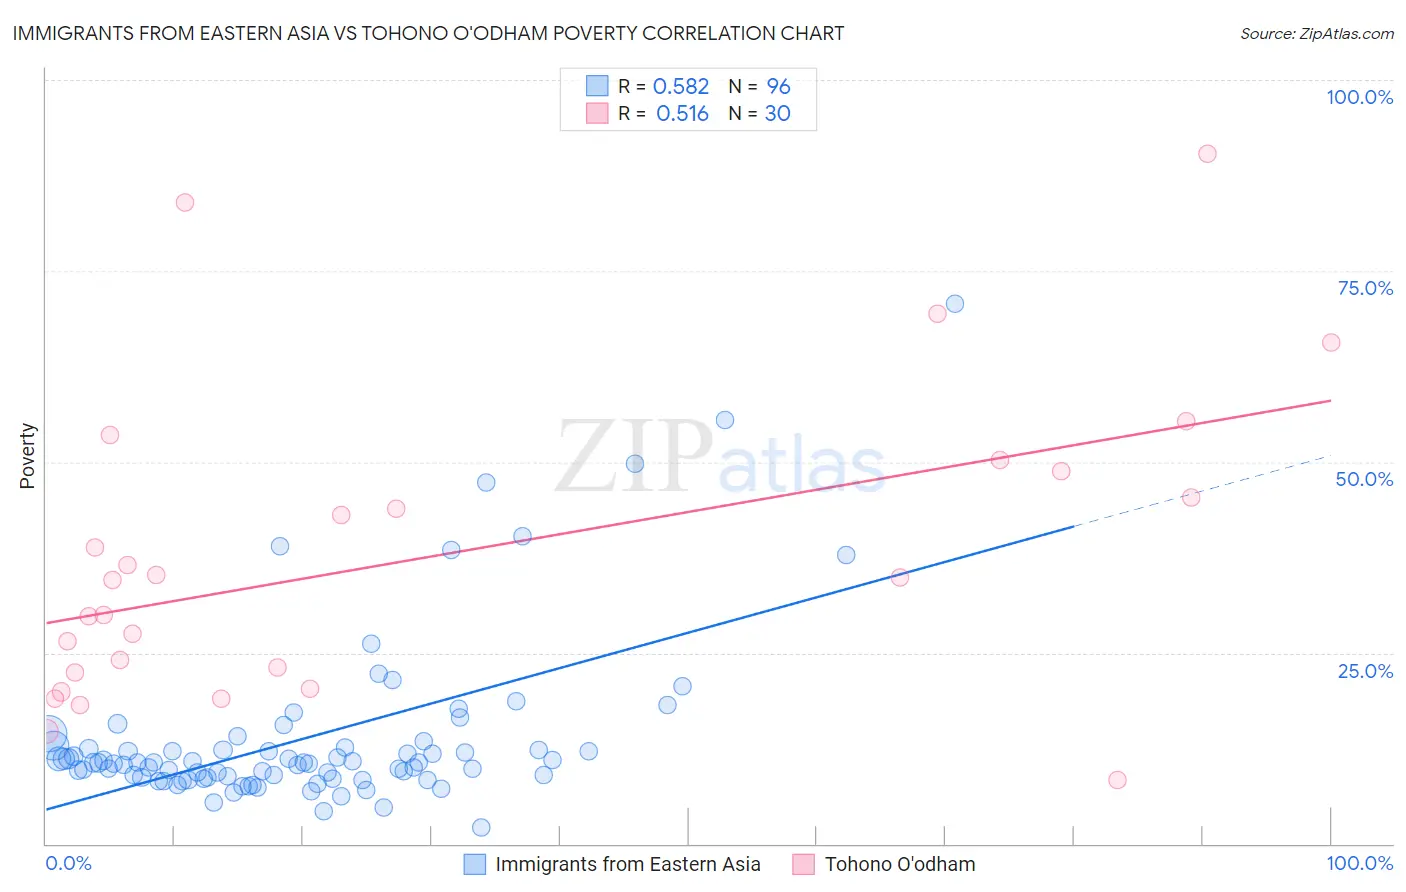
Immigrants from Eastern Asia vs Tohono O'odham Poverty Correlation Chart
The statistical analysis conducted on geographies consisting of 499,367,398 people shows a substantial positive correlation between the proportion of Immigrants from Eastern Asia and poverty level in the United States with a correlation coefficient (R) of 0.582 and weighted average of 11.3%. Similarly, the statistical analysis conducted on geographies consisting of 58,718,506 people shows a substantial positive correlation between the proportion of Tohono O'odham and poverty level in the United States with a correlation coefficient (R) of 0.516 and weighted average of 24.4%, a difference of 115.7%.
Poverty Correlation Summary
| Measurement | Immigrants from Eastern Asia | Tohono O'odham |
| Minimum | 2.1% | 8.3% |
| Maximum | 70.7% | 90.4% |
| Range | 68.7% | 82.0% |
| Mean | 13.9% | 37.7% |
| Median | 10.6% | 34.7% |
| Interquartile 25% (IQ1) | 8.6% | 22.4% |
| Interquartile 75% (IQ3) | 12.5% | 48.7% |
| Interquartile Range (IQR) | 3.8% | 26.3% |
| Standard Deviation (Sample) | 11.2% | 20.1% |
| Standard Deviation (Population) | 11.2% | 19.8% |
Similar Demographics by Poverty
Demographics Similar to Immigrants from Eastern Asia by Poverty
In terms of poverty, the demographic groups most similar to Immigrants from Eastern Asia are Dutch (11.3%, a difference of 0.010%), Cambodian (11.3%, a difference of 0.060%), Immigrants from North America (11.3%, a difference of 0.070%), Indian (Asian) (11.3%, a difference of 0.080%), and Irish (11.3%, a difference of 0.080%).
| Demographics | Rating | Rank | Poverty |
| Immigrants | Canada | 97.3 /100 | #70 | Exceptional 11.3% |
| Zimbabweans | 97.3 /100 | #71 | Exceptional 11.3% |
| Europeans | 97.2 /100 | #72 | Exceptional 11.3% |
| Immigrants | Belgium | 97.2 /100 | #73 | Exceptional 11.3% |
| Carpatho Rusyns | 97.2 /100 | #74 | Exceptional 11.3% |
| Immigrants | Eastern Europe | 97.0 /100 | #75 | Exceptional 11.3% |
| Immigrants | North America | 96.8 /100 | #76 | Exceptional 11.3% |
| Immigrants | Eastern Asia | 96.7 /100 | #77 | Exceptional 11.3% |
| Dutch | 96.7 /100 | #78 | Exceptional 11.3% |
| Cambodians | 96.7 /100 | #79 | Exceptional 11.3% |
| Indians (Asian) | 96.6 /100 | #80 | Exceptional 11.3% |
| Irish | 96.6 /100 | #81 | Exceptional 11.3% |
| Egyptians | 96.5 /100 | #82 | Exceptional 11.3% |
| Immigrants | Sweden | 96.3 /100 | #83 | Exceptional 11.3% |
| English | 96.3 /100 | #84 | Exceptional 11.3% |
Demographics Similar to Tohono O'odham by Poverty
In terms of poverty, the demographic groups most similar to Tohono O'odham are Puerto Rican (23.7%, a difference of 3.1%), Navajo (23.1%, a difference of 5.7%), Lumbee (21.9%, a difference of 11.3%), Pima (21.9%, a difference of 11.6%), and Immigrants from Yemen (21.5%, a difference of 13.4%).
| Demographics | Rating | Rank | Poverty |
| Houma | 0.0 /100 | #333 | Tragic 18.4% |
| Apache | 0.0 /100 | #334 | Tragic 18.4% |
| Cheyenne | 0.0 /100 | #335 | Tragic 18.9% |
| Pueblo | 0.0 /100 | #336 | Tragic 19.4% |
| Sioux | 0.0 /100 | #337 | Tragic 19.8% |
| Yuman | 0.0 /100 | #338 | Tragic 20.2% |
| Crow | 0.0 /100 | #339 | Tragic 20.7% |
| Yup'ik | 0.0 /100 | #340 | Tragic 20.8% |
| Hopi | 0.0 /100 | #341 | Tragic 20.8% |
| Immigrants | Yemen | 0.0 /100 | #342 | Tragic 21.5% |
| Pima | 0.0 /100 | #343 | Tragic 21.9% |
| Lumbee | 0.0 /100 | #344 | Tragic 21.9% |
| Navajo | 0.0 /100 | #345 | Tragic 23.1% |
| Puerto Ricans | 0.0 /100 | #346 | Tragic 23.7% |
| Tohono O'odham | 0.0 /100 | #347 | Tragic 24.4% |