Jamaican vs Guyanese Poverty
COMPARE
Jamaican
Guyanese
Poverty
Poverty Comparison
Jamaicans
Guyanese
14.4%
POVERTY
0.1/ 100
METRIC RATING
263rd/ 347
METRIC RANK
14.5%
POVERTY
0.1/ 100
METRIC RATING
266th/ 347
METRIC RANK
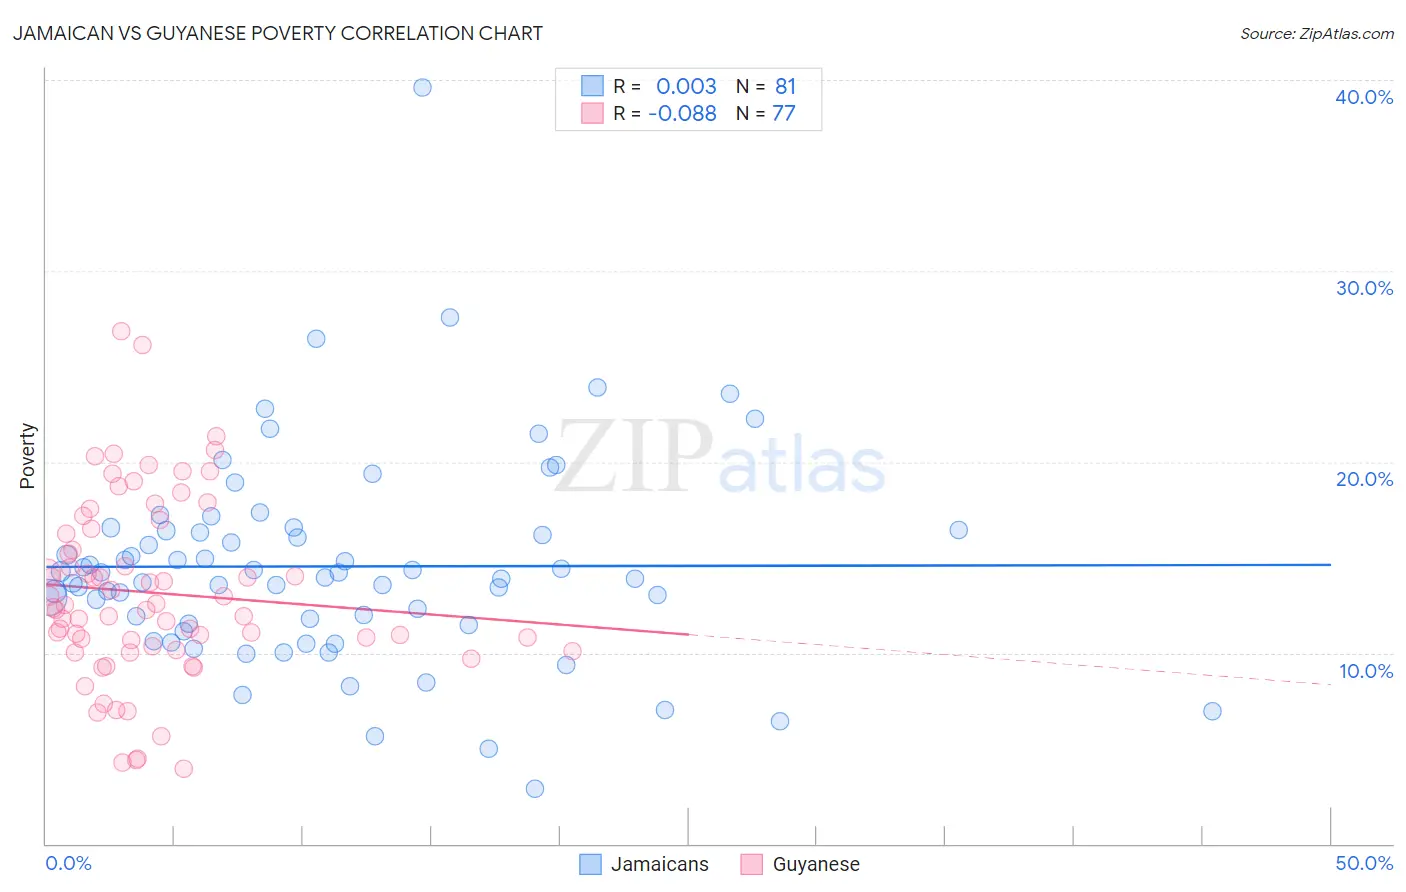
Jamaican vs Guyanese Poverty Correlation Chart
The statistical analysis conducted on geographies consisting of 367,709,935 people shows no correlation between the proportion of Jamaicans and poverty level in the United States with a correlation coefficient (R) of 0.003 and weighted average of 14.4%. Similarly, the statistical analysis conducted on geographies consisting of 176,811,902 people shows a slight negative correlation between the proportion of Guyanese and poverty level in the United States with a correlation coefficient (R) of -0.088 and weighted average of 14.5%, a difference of 0.38%.
Poverty Correlation Summary
| Measurement | Jamaican | Guyanese |
| Minimum | 2.9% | 3.9% |
| Maximum | 39.6% | 26.8% |
| Range | 36.7% | 22.9% |
| Mean | 14.5% | 13.1% |
| Median | 13.9% | 12.4% |
| Interquartile 25% (IQ1) | 11.5% | 10.2% |
| Interquartile 75% (IQ3) | 16.4% | 16.4% |
| Interquartile Range (IQR) | 4.9% | 6.2% |
| Standard Deviation (Sample) | 5.4% | 4.7% |
| Standard Deviation (Population) | 5.4% | 4.7% |
Demographics Similar to Jamaicans and Guyanese by Poverty
In terms of poverty, the demographic groups most similar to Jamaicans are Immigrants from Jamaica (14.4%, a difference of 0.090%), Immigrants from Guyana (14.5%, a difference of 0.21%), Immigrants from Liberia (14.4%, a difference of 0.35%), Cherokee (14.4%, a difference of 0.51%), and Cape Verdean (14.4%, a difference of 0.53%). Similarly, the demographic groups most similar to Guyanese are Immigrants from Guyana (14.5%, a difference of 0.17%), Immigrants from Jamaica (14.4%, a difference of 0.30%), Iroquois (14.5%, a difference of 0.32%), Subsaharan African (14.5%, a difference of 0.35%), and Immigrants from Cuba (14.6%, a difference of 0.51%).
| Demographics | Rating | Rank | Poverty |
| Immigrants | El Salvador | 0.1 /100 | #254 | Tragic 14.3% |
| Immigrants | Ecuador | 0.1 /100 | #255 | Tragic 14.3% |
| Mexican American Indians | 0.1 /100 | #256 | Tragic 14.3% |
| Trinidadians and Tobagonians | 0.1 /100 | #257 | Tragic 14.3% |
| Ottawa | 0.1 /100 | #258 | Tragic 14.3% |
| Immigrants | Nicaragua | 0.1 /100 | #259 | Tragic 14.3% |
| Cape Verdeans | 0.1 /100 | #260 | Tragic 14.4% |
| Cherokee | 0.1 /100 | #261 | Tragic 14.4% |
| Immigrants | Liberia | 0.1 /100 | #262 | Tragic 14.4% |
| Jamaicans | 0.1 /100 | #263 | Tragic 14.4% |
| Immigrants | Jamaica | 0.1 /100 | #264 | Tragic 14.4% |
| Immigrants | Guyana | 0.1 /100 | #265 | Tragic 14.5% |
| Guyanese | 0.1 /100 | #266 | Tragic 14.5% |
| Iroquois | 0.1 /100 | #267 | Tragic 14.5% |
| Sub-Saharan Africans | 0.1 /100 | #268 | Tragic 14.5% |
| Immigrants | Cuba | 0.1 /100 | #269 | Tragic 14.6% |
| Central Americans | 0.1 /100 | #270 | Tragic 14.6% |
| Shoshone | 0.0 /100 | #271 | Tragic 14.7% |
| Chickasaw | 0.0 /100 | #272 | Tragic 14.7% |
| Spanish Americans | 0.0 /100 | #273 | Tragic 14.7% |
| Barbadians | 0.0 /100 | #274 | Tragic 14.8% |