Jamaican vs Immigrants from Bolivia Poverty
COMPARE
Jamaican
Immigrants from Bolivia
Poverty
Poverty Comparison
Jamaicans
Immigrants from Bolivia
14.4%
POVERTY
0.1/ 100
METRIC RATING
263rd/ 347
METRIC RANK
10.4%
POVERTY
99.8/ 100
METRIC RATING
14th/ 347
METRIC RANK
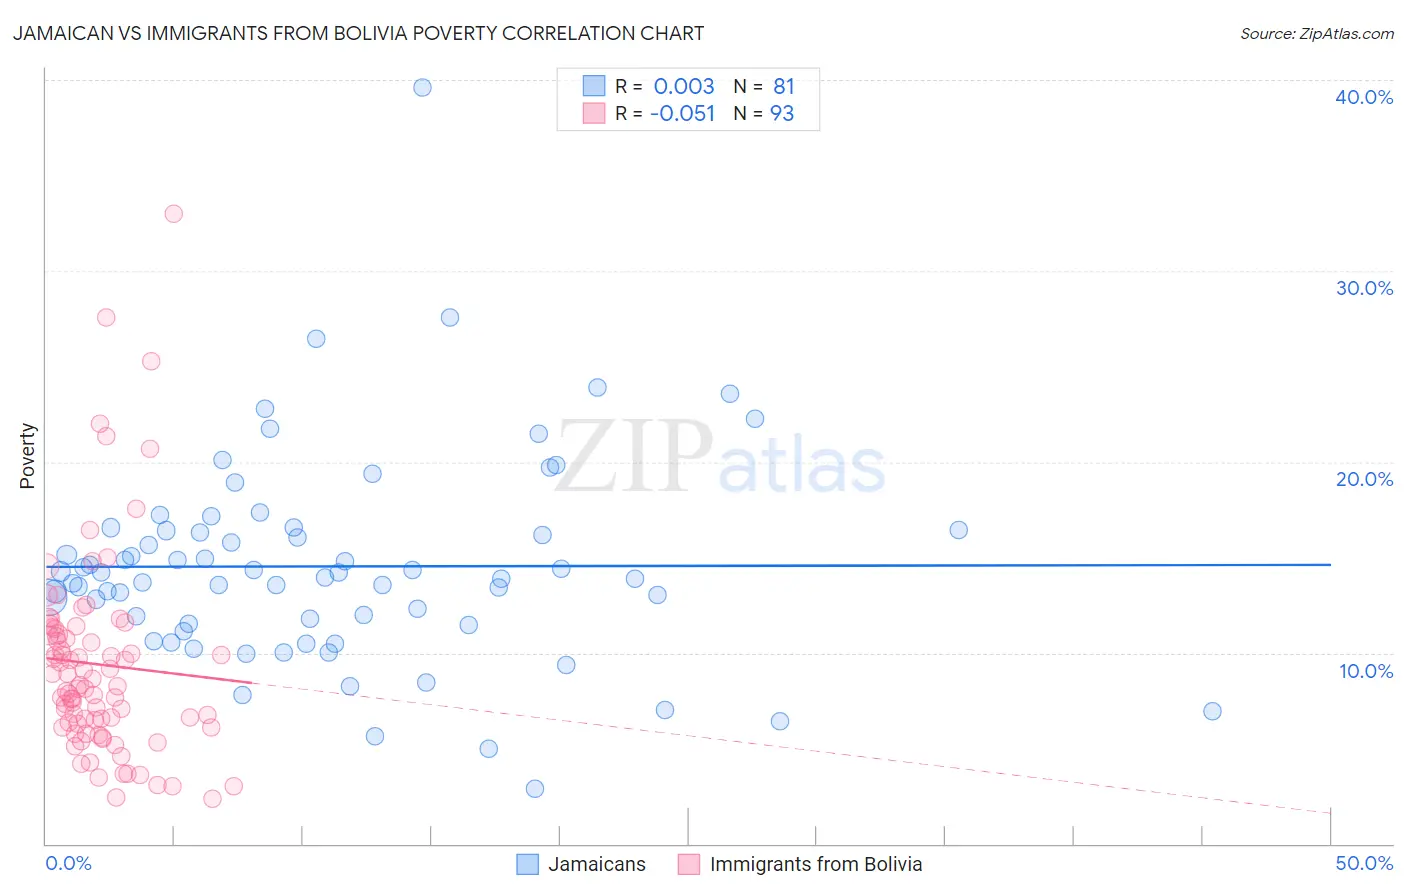
Jamaican vs Immigrants from Bolivia Poverty Correlation Chart
The statistical analysis conducted on geographies consisting of 367,709,935 people shows no correlation between the proportion of Jamaicans and poverty level in the United States with a correlation coefficient (R) of 0.003 and weighted average of 14.4%. Similarly, the statistical analysis conducted on geographies consisting of 158,712,653 people shows a slight negative correlation between the proportion of Immigrants from Bolivia and poverty level in the United States with a correlation coefficient (R) of -0.051 and weighted average of 10.4%, a difference of 38.2%.
Poverty Correlation Summary
| Measurement | Jamaican | Immigrants from Bolivia |
| Minimum | 2.9% | 2.3% |
| Maximum | 39.6% | 33.0% |
| Range | 36.7% | 30.6% |
| Mean | 14.5% | 9.4% |
| Median | 13.9% | 8.2% |
| Interquartile 25% (IQ1) | 11.5% | 6.2% |
| Interquartile 75% (IQ3) | 16.4% | 11.1% |
| Interquartile Range (IQR) | 4.9% | 4.9% |
| Standard Deviation (Sample) | 5.4% | 5.3% |
| Standard Deviation (Population) | 5.4% | 5.3% |
Similar Demographics by Poverty
Demographics Similar to Jamaicans by Poverty
In terms of poverty, the demographic groups most similar to Jamaicans are Immigrants from Jamaica (14.4%, a difference of 0.090%), Immigrants from Guyana (14.5%, a difference of 0.21%), Immigrants from Liberia (14.4%, a difference of 0.35%), Guyanese (14.5%, a difference of 0.38%), and Cherokee (14.4%, a difference of 0.51%).
| Demographics | Rating | Rank | Poverty |
| Mexican American Indians | 0.1 /100 | #256 | Tragic 14.3% |
| Trinidadians and Tobagonians | 0.1 /100 | #257 | Tragic 14.3% |
| Ottawa | 0.1 /100 | #258 | Tragic 14.3% |
| Immigrants | Nicaragua | 0.1 /100 | #259 | Tragic 14.3% |
| Cape Verdeans | 0.1 /100 | #260 | Tragic 14.4% |
| Cherokee | 0.1 /100 | #261 | Tragic 14.4% |
| Immigrants | Liberia | 0.1 /100 | #262 | Tragic 14.4% |
| Jamaicans | 0.1 /100 | #263 | Tragic 14.4% |
| Immigrants | Jamaica | 0.1 /100 | #264 | Tragic 14.4% |
| Immigrants | Guyana | 0.1 /100 | #265 | Tragic 14.5% |
| Guyanese | 0.1 /100 | #266 | Tragic 14.5% |
| Iroquois | 0.1 /100 | #267 | Tragic 14.5% |
| Sub-Saharan Africans | 0.1 /100 | #268 | Tragic 14.5% |
| Immigrants | Cuba | 0.1 /100 | #269 | Tragic 14.6% |
| Central Americans | 0.1 /100 | #270 | Tragic 14.6% |
Demographics Similar to Immigrants from Bolivia by Poverty
In terms of poverty, the demographic groups most similar to Immigrants from Bolivia are Bolivian (10.4%, a difference of 0.010%), Immigrants from Hong Kong (10.4%, a difference of 0.31%), Lithuanian (10.5%, a difference of 0.31%), Bhutanese (10.4%, a difference of 0.53%), and Norwegian (10.5%, a difference of 0.68%).
| Demographics | Rating | Rank | Poverty |
| Filipinos | 99.9 /100 | #7 | Exceptional 10.1% |
| Maltese | 99.9 /100 | #8 | Exceptional 10.2% |
| Immigrants | South Central Asia | 99.9 /100 | #9 | Exceptional 10.2% |
| Bulgarians | 99.9 /100 | #10 | Exceptional 10.2% |
| Immigrants | Lithuania | 99.9 /100 | #11 | Exceptional 10.3% |
| Bhutanese | 99.8 /100 | #12 | Exceptional 10.4% |
| Immigrants | Hong Kong | 99.8 /100 | #13 | Exceptional 10.4% |
| Immigrants | Bolivia | 99.8 /100 | #14 | Exceptional 10.4% |
| Bolivians | 99.8 /100 | #15 | Exceptional 10.4% |
| Lithuanians | 99.8 /100 | #16 | Exceptional 10.5% |
| Norwegians | 99.8 /100 | #17 | Exceptional 10.5% |
| Latvians | 99.8 /100 | #18 | Exceptional 10.5% |
| Immigrants | Scotland | 99.7 /100 | #19 | Exceptional 10.6% |
| Immigrants | North Macedonia | 99.7 /100 | #20 | Exceptional 10.6% |
| Luxembourgers | 99.7 /100 | #21 | Exceptional 10.6% |