Jamaican vs Welsh Poverty
COMPARE
Jamaican
Welsh
Poverty
Poverty Comparison
Jamaicans
Welsh
14.4%
POVERTY
0.1/ 100
METRIC RATING
263rd/ 347
METRIC RANK
11.6%
POVERTY
91.6/ 100
METRIC RATING
110th/ 347
METRIC RANK
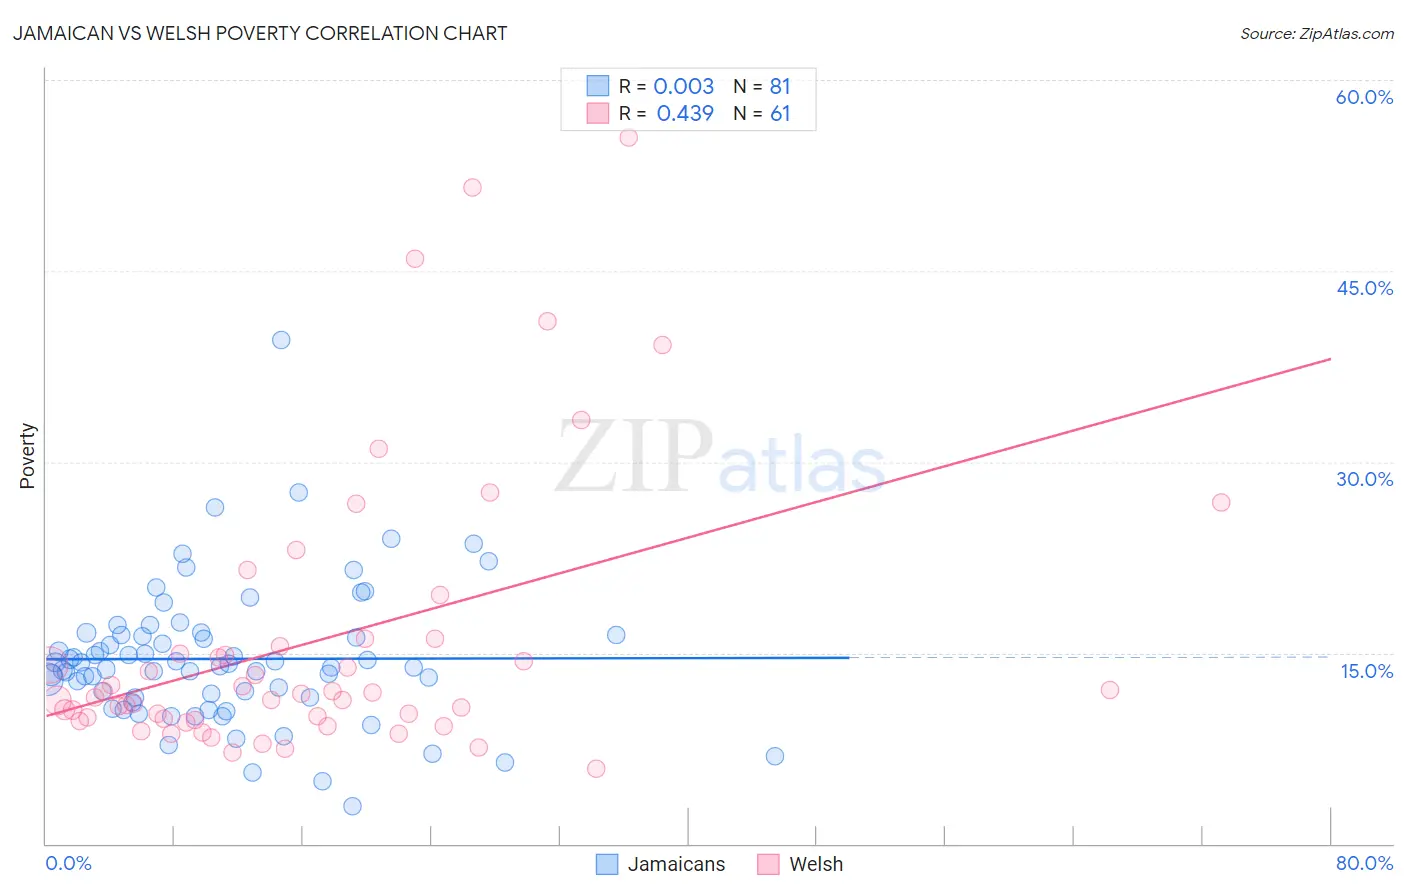
Jamaican vs Welsh Poverty Correlation Chart
The statistical analysis conducted on geographies consisting of 367,709,935 people shows no correlation between the proportion of Jamaicans and poverty level in the United States with a correlation coefficient (R) of 0.003 and weighted average of 14.4%. Similarly, the statistical analysis conducted on geographies consisting of 528,094,274 people shows a moderate positive correlation between the proportion of Welsh and poverty level in the United States with a correlation coefficient (R) of 0.439 and weighted average of 11.6%, a difference of 24.3%.
Poverty Correlation Summary
| Measurement | Jamaican | Welsh |
| Minimum | 2.9% | 5.9% |
| Maximum | 39.6% | 55.5% |
| Range | 36.7% | 49.6% |
| Mean | 14.5% | 16.0% |
| Median | 13.9% | 11.8% |
| Interquartile 25% (IQ1) | 11.5% | 9.8% |
| Interquartile 75% (IQ3) | 16.4% | 15.8% |
| Interquartile Range (IQR) | 4.9% | 6.0% |
| Standard Deviation (Sample) | 5.4% | 11.0% |
| Standard Deviation (Population) | 5.4% | 11.0% |
Similar Demographics by Poverty
Demographics Similar to Jamaicans by Poverty
In terms of poverty, the demographic groups most similar to Jamaicans are Immigrants from Jamaica (14.4%, a difference of 0.090%), Immigrants from Guyana (14.5%, a difference of 0.21%), Immigrants from Liberia (14.4%, a difference of 0.35%), Guyanese (14.5%, a difference of 0.38%), and Cherokee (14.4%, a difference of 0.51%).
| Demographics | Rating | Rank | Poverty |
| Mexican American Indians | 0.1 /100 | #256 | Tragic 14.3% |
| Trinidadians and Tobagonians | 0.1 /100 | #257 | Tragic 14.3% |
| Ottawa | 0.1 /100 | #258 | Tragic 14.3% |
| Immigrants | Nicaragua | 0.1 /100 | #259 | Tragic 14.3% |
| Cape Verdeans | 0.1 /100 | #260 | Tragic 14.4% |
| Cherokee | 0.1 /100 | #261 | Tragic 14.4% |
| Immigrants | Liberia | 0.1 /100 | #262 | Tragic 14.4% |
| Jamaicans | 0.1 /100 | #263 | Tragic 14.4% |
| Immigrants | Jamaica | 0.1 /100 | #264 | Tragic 14.4% |
| Immigrants | Guyana | 0.1 /100 | #265 | Tragic 14.5% |
| Guyanese | 0.1 /100 | #266 | Tragic 14.5% |
| Iroquois | 0.1 /100 | #267 | Tragic 14.5% |
| Sub-Saharan Africans | 0.1 /100 | #268 | Tragic 14.5% |
| Immigrants | Cuba | 0.1 /100 | #269 | Tragic 14.6% |
| Central Americans | 0.1 /100 | #270 | Tragic 14.6% |
Demographics Similar to Welsh by Poverty
In terms of poverty, the demographic groups most similar to Welsh are Immigrants from Turkey (11.6%, a difference of 0.040%), Canadian (11.6%, a difference of 0.060%), Palestinian (11.6%, a difference of 0.090%), French Canadian (11.6%, a difference of 0.17%), and Portuguese (11.6%, a difference of 0.18%).
| Demographics | Rating | Rank | Poverty |
| Okinawans | 92.4 /100 | #103 | Exceptional 11.6% |
| Native Hawaiians | 92.1 /100 | #104 | Exceptional 11.6% |
| Portuguese | 92.1 /100 | #105 | Exceptional 11.6% |
| Immigrants | Zimbabwe | 92.1 /100 | #106 | Exceptional 11.6% |
| Palestinians | 91.8 /100 | #107 | Exceptional 11.6% |
| Canadians | 91.7 /100 | #108 | Exceptional 11.6% |
| Immigrants | Turkey | 91.7 /100 | #109 | Exceptional 11.6% |
| Welsh | 91.6 /100 | #110 | Exceptional 11.6% |
| French Canadians | 91.0 /100 | #111 | Exceptional 11.6% |
| Immigrants | Southern Europe | 90.8 /100 | #112 | Exceptional 11.6% |
| Immigrants | Belarus | 90.8 /100 | #113 | Exceptional 11.6% |
| Immigrants | China | 90.7 /100 | #114 | Exceptional 11.6% |
| Albanians | 90.3 /100 | #115 | Exceptional 11.7% |
| Immigrants | Russia | 89.7 /100 | #116 | Excellent 11.7% |
| Sri Lankans | 89.4 /100 | #117 | Excellent 11.7% |