Jamaican vs Osage Poverty
COMPARE
Jamaican
Osage
Poverty
Poverty Comparison
Jamaicans
Osage
14.4%
POVERTY
0.1/ 100
METRIC RATING
263rd/ 347
METRIC RANK
13.6%
POVERTY
1.5/ 100
METRIC RATING
229th/ 347
METRIC RANK
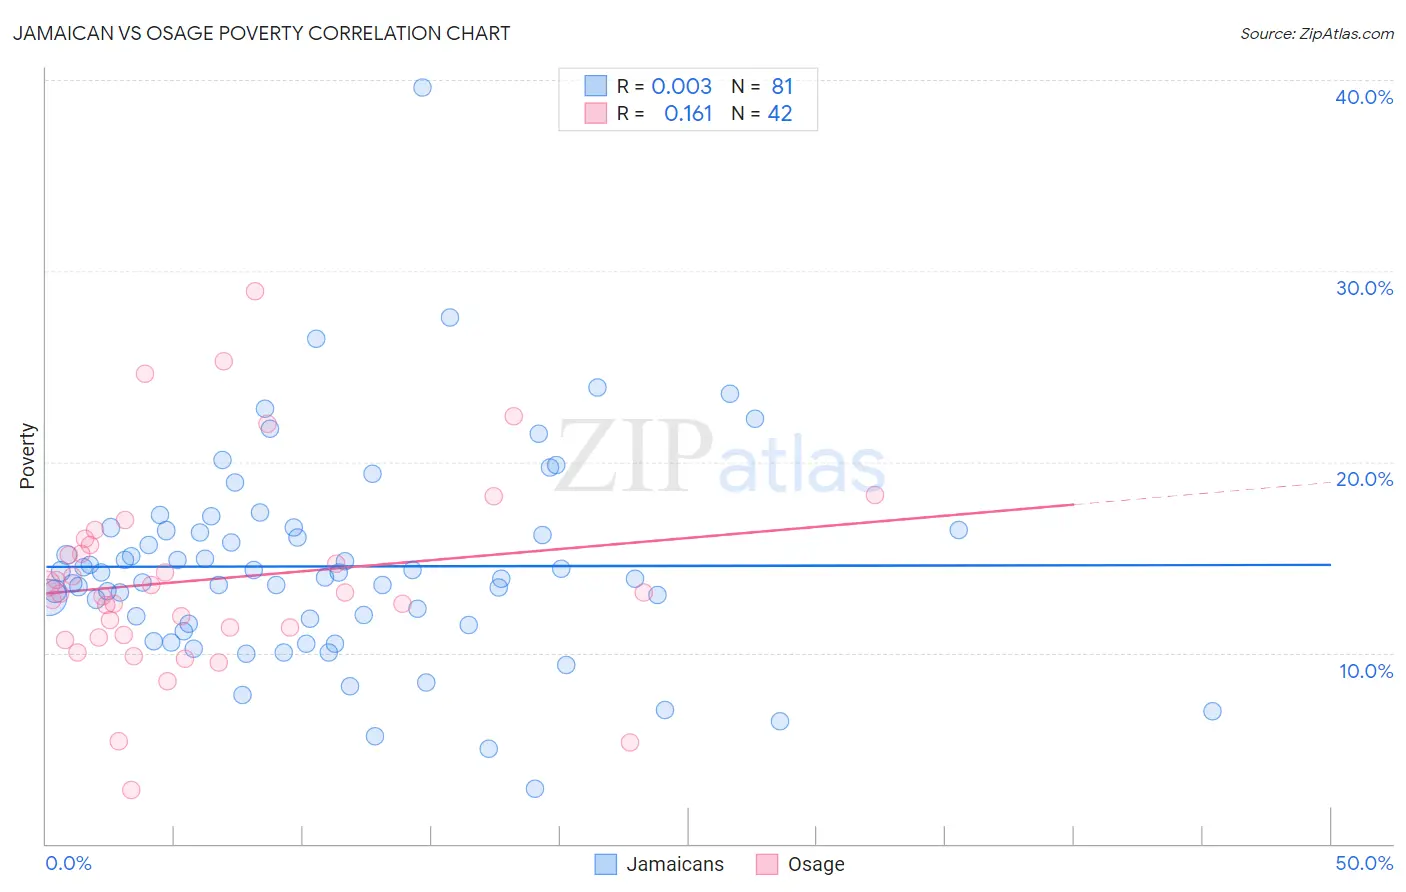
Jamaican vs Osage Poverty Correlation Chart
The statistical analysis conducted on geographies consisting of 367,709,935 people shows no correlation between the proportion of Jamaicans and poverty level in the United States with a correlation coefficient (R) of 0.003 and weighted average of 14.4%. Similarly, the statistical analysis conducted on geographies consisting of 91,797,306 people shows a poor positive correlation between the proportion of Osage and poverty level in the United States with a correlation coefficient (R) of 0.161 and weighted average of 13.6%, a difference of 6.4%.
Poverty Correlation Summary
| Measurement | Jamaican | Osage |
| Minimum | 2.9% | 2.8% |
| Maximum | 39.6% | 28.9% |
| Range | 36.7% | 26.1% |
| Mean | 14.5% | 13.8% |
| Median | 13.9% | 13.1% |
| Interquartile 25% (IQ1) | 11.5% | 10.9% |
| Interquartile 75% (IQ3) | 16.4% | 15.7% |
| Interquartile Range (IQR) | 4.9% | 4.7% |
| Standard Deviation (Sample) | 5.4% | 5.2% |
| Standard Deviation (Population) | 5.4% | 5.1% |
Similar Demographics by Poverty
Demographics Similar to Jamaicans by Poverty
In terms of poverty, the demographic groups most similar to Jamaicans are Immigrants from Jamaica (14.4%, a difference of 0.090%), Immigrants from Guyana (14.5%, a difference of 0.21%), Immigrants from Liberia (14.4%, a difference of 0.35%), Guyanese (14.5%, a difference of 0.38%), and Cherokee (14.4%, a difference of 0.51%).
| Demographics | Rating | Rank | Poverty |
| Mexican American Indians | 0.1 /100 | #256 | Tragic 14.3% |
| Trinidadians and Tobagonians | 0.1 /100 | #257 | Tragic 14.3% |
| Ottawa | 0.1 /100 | #258 | Tragic 14.3% |
| Immigrants | Nicaragua | 0.1 /100 | #259 | Tragic 14.3% |
| Cape Verdeans | 0.1 /100 | #260 | Tragic 14.4% |
| Cherokee | 0.1 /100 | #261 | Tragic 14.4% |
| Immigrants | Liberia | 0.1 /100 | #262 | Tragic 14.4% |
| Jamaicans | 0.1 /100 | #263 | Tragic 14.4% |
| Immigrants | Jamaica | 0.1 /100 | #264 | Tragic 14.4% |
| Immigrants | Guyana | 0.1 /100 | #265 | Tragic 14.5% |
| Guyanese | 0.1 /100 | #266 | Tragic 14.5% |
| Iroquois | 0.1 /100 | #267 | Tragic 14.5% |
| Sub-Saharan Africans | 0.1 /100 | #268 | Tragic 14.5% |
| Immigrants | Cuba | 0.1 /100 | #269 | Tragic 14.6% |
| Central Americans | 0.1 /100 | #270 | Tragic 14.6% |
Demographics Similar to Osage by Poverty
In terms of poverty, the demographic groups most similar to Osage are Alaskan Athabascan (13.6%, a difference of 0.060%), Nigerian (13.6%, a difference of 0.22%), Immigrants from Nigeria (13.5%, a difference of 0.24%), Alaska Native (13.5%, a difference of 0.69%), and Marshallese (13.4%, a difference of 0.85%).
| Demographics | Rating | Rank | Poverty |
| Immigrants | Micronesia | 2.6 /100 | #222 | Tragic 13.4% |
| Immigrants | Africa | 2.5 /100 | #223 | Tragic 13.4% |
| Immigrants | Eritrea | 2.4 /100 | #224 | Tragic 13.4% |
| German Russians | 2.2 /100 | #225 | Tragic 13.4% |
| Marshallese | 2.2 /100 | #226 | Tragic 13.4% |
| Alaska Natives | 2.1 /100 | #227 | Tragic 13.5% |
| Immigrants | Nigeria | 1.7 /100 | #228 | Tragic 13.5% |
| Osage | 1.5 /100 | #229 | Tragic 13.6% |
| Alaskan Athabascans | 1.5 /100 | #230 | Tragic 13.6% |
| Nigerians | 1.4 /100 | #231 | Tragic 13.6% |
| Fijians | 0.8 /100 | #232 | Tragic 13.7% |
| Immigrants | Saudi Arabia | 0.8 /100 | #233 | Tragic 13.8% |
| Immigrants | Laos | 0.7 /100 | #234 | Tragic 13.8% |
| Cubans | 0.6 /100 | #235 | Tragic 13.9% |
| Immigrants | Armenia | 0.5 /100 | #236 | Tragic 13.9% |