Jamaican vs South American Indian Poverty
COMPARE
Jamaican
South American Indian
Poverty
Poverty Comparison
Jamaicans
South American Indians
14.4%
POVERTY
0.1/ 100
METRIC RATING
263rd/ 347
METRIC RANK
12.7%
POVERTY
23.3/ 100
METRIC RATING
192nd/ 347
METRIC RANK
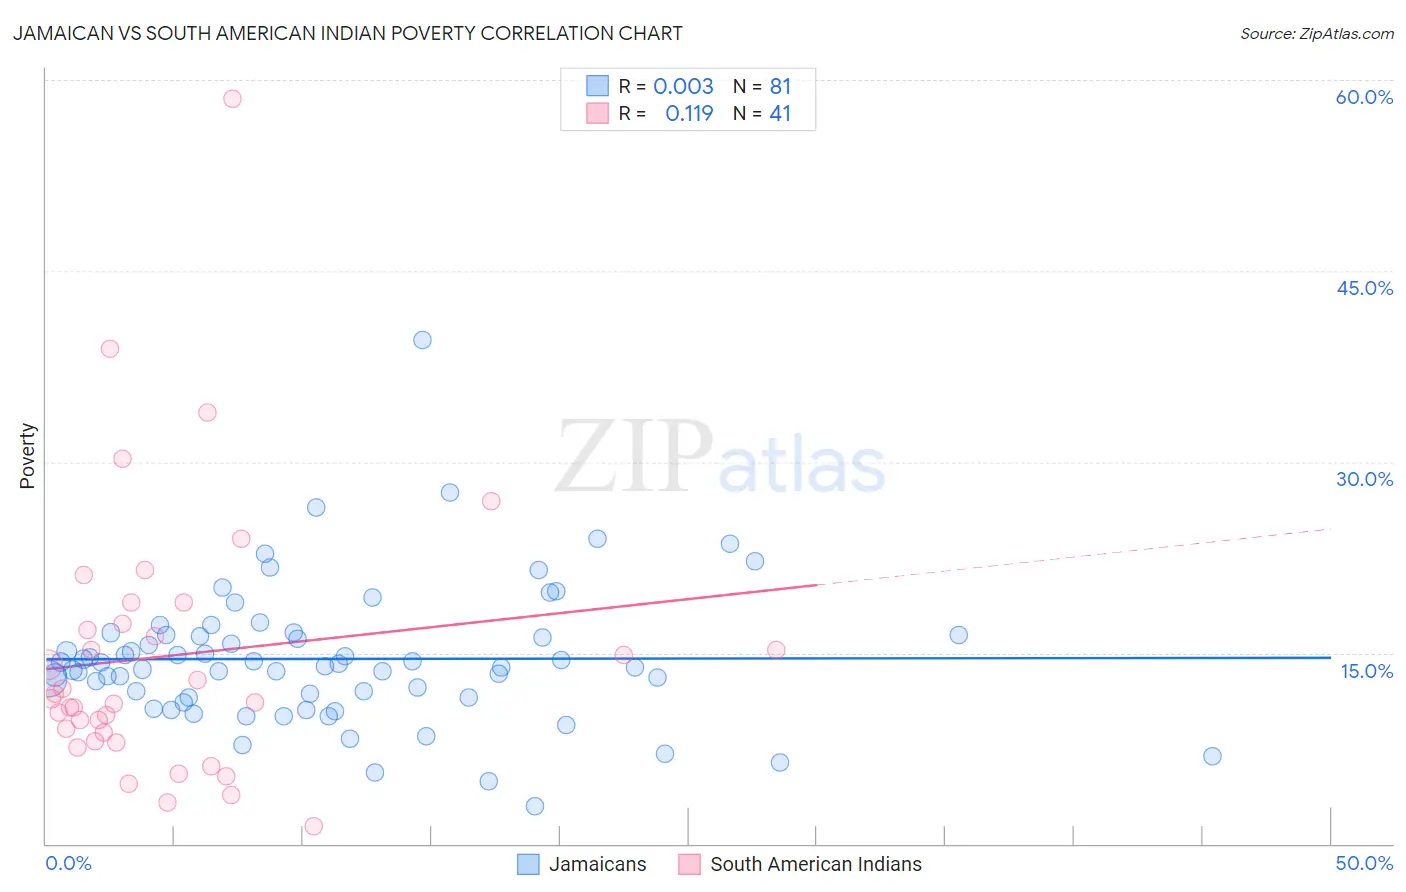
Jamaican vs South American Indian Poverty Correlation Chart
The statistical analysis conducted on geographies consisting of 367,709,935 people shows no correlation between the proportion of Jamaicans and poverty level in the United States with a correlation coefficient (R) of 0.003 and weighted average of 14.4%. Similarly, the statistical analysis conducted on geographies consisting of 164,528,335 people shows a poor positive correlation between the proportion of South American Indians and poverty level in the United States with a correlation coefficient (R) of 0.119 and weighted average of 12.7%, a difference of 13.8%.
Poverty Correlation Summary
| Measurement | Jamaican | South American Indian |
| Minimum | 2.9% | 1.4% |
| Maximum | 39.6% | 58.5% |
| Range | 36.7% | 57.1% |
| Mean | 14.5% | 14.8% |
| Median | 13.9% | 11.4% |
| Interquartile 25% (IQ1) | 11.5% | 8.4% |
| Interquartile 75% (IQ3) | 16.4% | 18.2% |
| Interquartile Range (IQR) | 4.9% | 9.8% |
| Standard Deviation (Sample) | 5.4% | 10.8% |
| Standard Deviation (Population) | 5.4% | 10.6% |
Similar Demographics by Poverty
Demographics Similar to Jamaicans by Poverty
In terms of poverty, the demographic groups most similar to Jamaicans are Immigrants from Jamaica (14.4%, a difference of 0.090%), Immigrants from Guyana (14.5%, a difference of 0.21%), Immigrants from Liberia (14.4%, a difference of 0.35%), Guyanese (14.5%, a difference of 0.38%), and Cherokee (14.4%, a difference of 0.51%).
| Demographics | Rating | Rank | Poverty |
| Mexican American Indians | 0.1 /100 | #256 | Tragic 14.3% |
| Trinidadians and Tobagonians | 0.1 /100 | #257 | Tragic 14.3% |
| Ottawa | 0.1 /100 | #258 | Tragic 14.3% |
| Immigrants | Nicaragua | 0.1 /100 | #259 | Tragic 14.3% |
| Cape Verdeans | 0.1 /100 | #260 | Tragic 14.4% |
| Cherokee | 0.1 /100 | #261 | Tragic 14.4% |
| Immigrants | Liberia | 0.1 /100 | #262 | Tragic 14.4% |
| Jamaicans | 0.1 /100 | #263 | Tragic 14.4% |
| Immigrants | Jamaica | 0.1 /100 | #264 | Tragic 14.4% |
| Immigrants | Guyana | 0.1 /100 | #265 | Tragic 14.5% |
| Guyanese | 0.1 /100 | #266 | Tragic 14.5% |
| Iroquois | 0.1 /100 | #267 | Tragic 14.5% |
| Sub-Saharan Africans | 0.1 /100 | #268 | Tragic 14.5% |
| Immigrants | Cuba | 0.1 /100 | #269 | Tragic 14.6% |
| Central Americans | 0.1 /100 | #270 | Tragic 14.6% |
Demographics Similar to South American Indians by Poverty
In terms of poverty, the demographic groups most similar to South American Indians are Delaware (12.7%, a difference of 0.25%), Arab (12.7%, a difference of 0.29%), Immigrants from Kuwait (12.7%, a difference of 0.33%), Iraqi (12.7%, a difference of 0.34%), and Immigrants from Lebanon (12.8%, a difference of 0.65%).
| Demographics | Rating | Rank | Poverty |
| Israelis | 36.4 /100 | #185 | Fair 12.5% |
| Immigrants | Sierra Leone | 36.3 /100 | #186 | Fair 12.5% |
| Hawaiians | 34.1 /100 | #187 | Fair 12.5% |
| Immigrants | Costa Rica | 33.3 /100 | #188 | Fair 12.5% |
| Aleuts | 33.2 /100 | #189 | Fair 12.5% |
| Immigrants | South America | 32.3 /100 | #190 | Fair 12.5% |
| Sierra Leoneans | 31.5 /100 | #191 | Fair 12.6% |
| South American Indians | 23.3 /100 | #192 | Fair 12.7% |
| Delaware | 21.4 /100 | #193 | Fair 12.7% |
| Arabs | 21.1 /100 | #194 | Fair 12.7% |
| Immigrants | Kuwait | 20.9 /100 | #195 | Fair 12.7% |
| Iraqis | 20.8 /100 | #196 | Fair 12.7% |
| Immigrants | Lebanon | 18.7 /100 | #197 | Poor 12.8% |
| Spanish | 18.7 /100 | #198 | Poor 12.8% |
| Immigrants | Kenya | 17.5 /100 | #199 | Poor 12.8% |