Jamaican vs Tohono O'odham Divorced or Separated
COMPARE
Jamaican
Tohono O'odham
Divorced or Separated
Divorced or Separated Comparison
Jamaicans
Tohono O'odham
12.9%
DIVORCED OR SEPARATED
0.0/ 100
METRIC RATING
293rd/ 347
METRIC RANK
12.0%
DIVORCED OR SEPARATED
60.4/ 100
METRIC RATING
166th/ 347
METRIC RANK
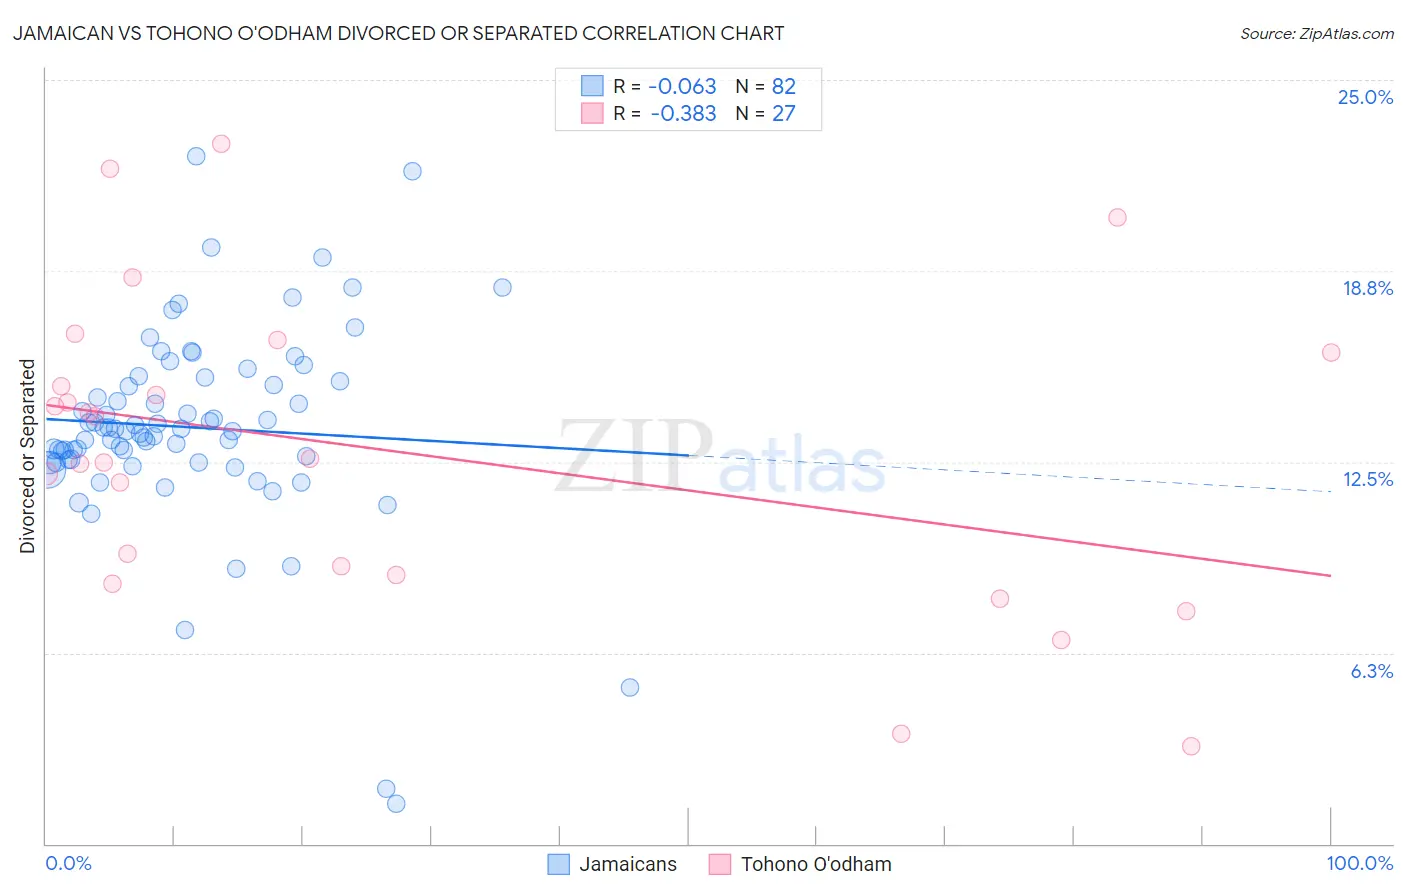
Jamaican vs Tohono O'odham Divorced or Separated Correlation Chart
The statistical analysis conducted on geographies consisting of 367,802,354 people shows a slight negative correlation between the proportion of Jamaicans and percentage of population currently divorced or separated in the United States with a correlation coefficient (R) of -0.063 and weighted average of 12.9%. Similarly, the statistical analysis conducted on geographies consisting of 58,729,123 people shows a mild negative correlation between the proportion of Tohono O'odham and percentage of population currently divorced or separated in the United States with a correlation coefficient (R) of -0.383 and weighted average of 12.0%, a difference of 7.6%.
Divorced or Separated Correlation Summary
| Measurement | Jamaican | Tohono O'odham |
| Minimum | 1.3% | 3.2% |
| Maximum | 22.5% | 22.9% |
| Range | 21.2% | 19.7% |
| Mean | 13.6% | 12.8% |
| Median | 13.5% | 12.6% |
| Interquartile 25% (IQ1) | 12.6% | 8.8% |
| Interquartile 75% (IQ3) | 15.2% | 16.1% |
| Interquartile Range (IQR) | 2.6% | 7.3% |
| Standard Deviation (Sample) | 3.3% | 5.0% |
| Standard Deviation (Population) | 3.3% | 5.0% |
Similar Demographics by Divorced or Separated
Demographics Similar to Jamaicans by Divorced or Separated
In terms of divorced or separated, the demographic groups most similar to Jamaicans are Apache (12.9%, a difference of 0.030%), Celtic (13.0%, a difference of 0.16%), Scotch-Irish (12.9%, a difference of 0.21%), Immigrants from Honduras (12.9%, a difference of 0.27%), and Pima (12.9%, a difference of 0.38%).
| Demographics | Rating | Rank | Divorced or Separated |
| Spanish | 0.1 /100 | #286 | Tragic 12.8% |
| Hondurans | 0.1 /100 | #287 | Tragic 12.8% |
| French Canadians | 0.1 /100 | #288 | Tragic 12.8% |
| Iroquois | 0.0 /100 | #289 | Tragic 12.9% |
| Pima | 0.0 /100 | #290 | Tragic 12.9% |
| Immigrants | Honduras | 0.0 /100 | #291 | Tragic 12.9% |
| Scotch-Irish | 0.0 /100 | #292 | Tragic 12.9% |
| Jamaicans | 0.0 /100 | #293 | Tragic 12.9% |
| Apache | 0.0 /100 | #294 | Tragic 12.9% |
| Celtics | 0.0 /100 | #295 | Tragic 13.0% |
| Nicaraguans | 0.0 /100 | #296 | Tragic 13.0% |
| Natives/Alaskans | 0.0 /100 | #297 | Tragic 13.0% |
| Venezuelans | 0.0 /100 | #298 | Tragic 13.0% |
| Immigrants | Jamaica | 0.0 /100 | #299 | Tragic 13.0% |
| Immigrants | Cabo Verde | 0.0 /100 | #300 | Tragic 13.1% |
Demographics Similar to Tohono O'odham by Divorced or Separated
In terms of divorced or separated, the demographic groups most similar to Tohono O'odham are German Russian (12.0%, a difference of 0.050%), Ethiopian (12.0%, a difference of 0.070%), Swiss (12.0%, a difference of 0.12%), Serbian (12.0%, a difference of 0.12%), and Immigrants from Peru (12.0%, a difference of 0.12%).
| Demographics | Rating | Rank | Divorced or Separated |
| Immigrants | Barbados | 66.0 /100 | #159 | Good 12.0% |
| Immigrants | Scotland | 65.8 /100 | #160 | Good 12.0% |
| Marshallese | 64.6 /100 | #161 | Good 12.0% |
| Samoans | 64.3 /100 | #162 | Good 12.0% |
| Navajo | 63.9 /100 | #163 | Good 12.0% |
| Swiss | 63.6 /100 | #164 | Good 12.0% |
| German Russians | 61.8 /100 | #165 | Good 12.0% |
| Tohono O'odham | 60.4 /100 | #166 | Good 12.0% |
| Ethiopians | 58.5 /100 | #167 | Average 12.0% |
| Serbians | 57.1 /100 | #168 | Average 12.0% |
| Immigrants | Peru | 57.0 /100 | #169 | Average 12.0% |
| Mexican American Indians | 55.8 /100 | #170 | Average 12.0% |
| Costa Ricans | 53.3 /100 | #171 | Average 12.0% |
| Immigrants | Mexico | 53.2 /100 | #172 | Average 12.0% |
| Immigrants | Moldova | 50.4 /100 | #173 | Average 12.1% |