Jamaican vs Tohono O'odham Nursery School
COMPARE
Jamaican
Tohono O'odham
Nursery School
Nursery School Comparison
Jamaicans
Tohono O'odham
97.6%
NURSERY SCHOOL
0.6/ 100
METRIC RATING
258th/ 347
METRIC RANK
97.9%
NURSERY SCHOOL
22.2/ 100
METRIC RATING
200th/ 347
METRIC RANK
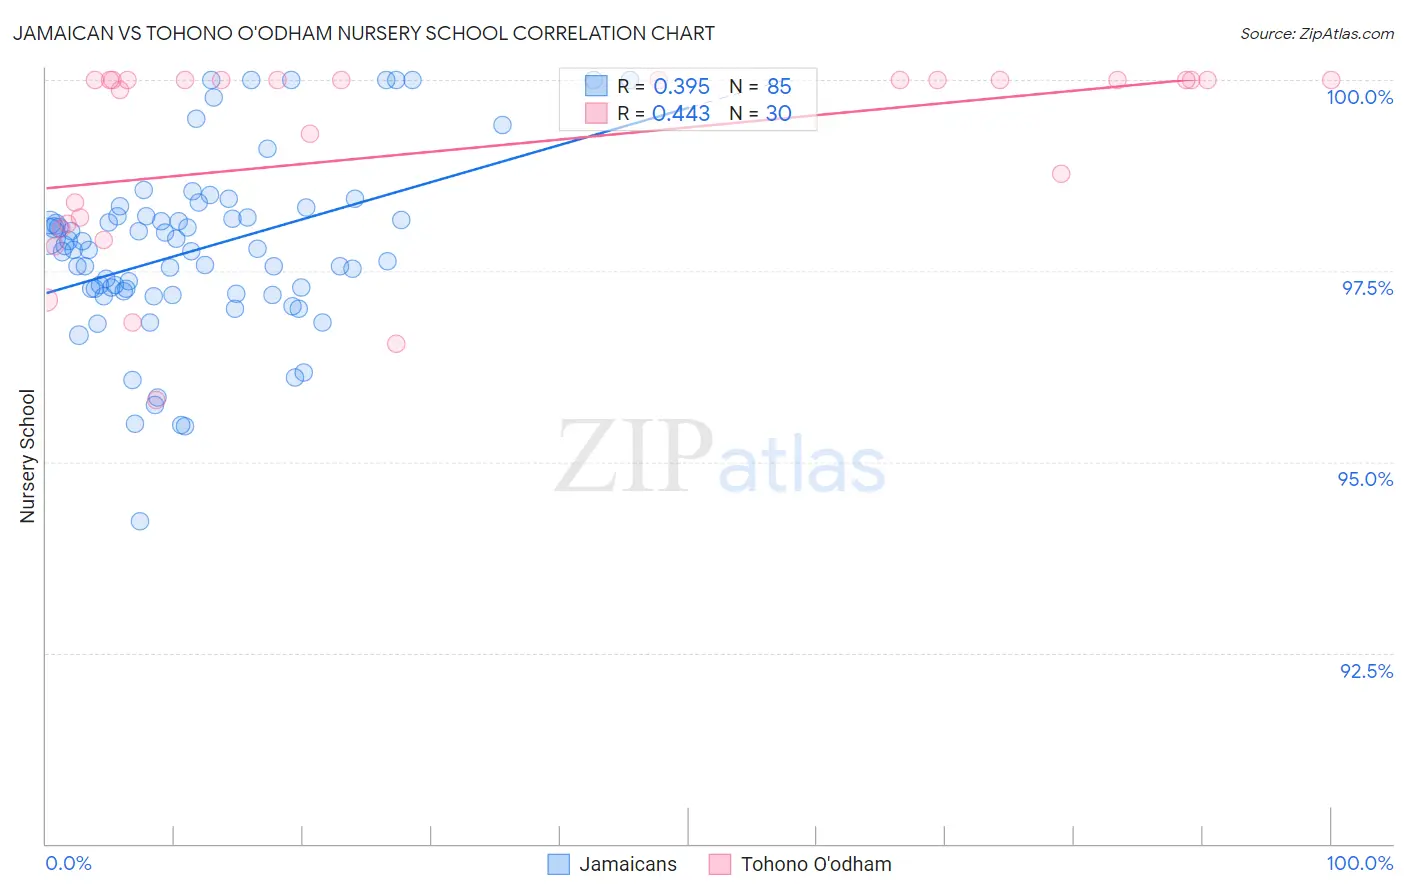
Jamaican vs Tohono O'odham Nursery School Correlation Chart
The statistical analysis conducted on geographies consisting of 368,084,732 people shows a mild positive correlation between the proportion of Jamaicans and percentage of population with at least nursery school education in the United States with a correlation coefficient (R) of 0.395 and weighted average of 97.6%. Similarly, the statistical analysis conducted on geographies consisting of 58,723,100 people shows a moderate positive correlation between the proportion of Tohono O'odham and percentage of population with at least nursery school education in the United States with a correlation coefficient (R) of 0.443 and weighted average of 97.9%, a difference of 0.29%.
Nursery School Correlation Summary
| Measurement | Jamaican | Tohono O'odham |
| Minimum | 94.2% | 95.8% |
| Maximum | 100.0% | 100.0% |
| Range | 5.8% | 4.2% |
| Mean | 97.8% | 99.1% |
| Median | 97.8% | 100.0% |
| Interquartile 25% (IQ1) | 97.2% | 98.1% |
| Interquartile 75% (IQ3) | 98.2% | 100.0% |
| Interquartile Range (IQR) | 1.0% | 1.9% |
| Standard Deviation (Sample) | 1.2% | 1.3% |
| Standard Deviation (Population) | 1.1% | 1.3% |
Similar Demographics by Nursery School
Demographics Similar to Jamaicans by Nursery School
In terms of nursery school, the demographic groups most similar to Jamaicans are Immigrants from Colombia (97.6%, a difference of 0.0%), Immigrants from Congo (97.6%, a difference of 0.010%), Immigrants from Asia (97.6%, a difference of 0.010%), Yaqui (97.6%, a difference of 0.010%), and Ethiopian (97.6%, a difference of 0.020%).
| Demographics | Rating | Rank | Nursery School |
| Ethiopians | 0.8 /100 | #251 | Tragic 97.6% |
| Immigrants | Africa | 0.8 /100 | #252 | Tragic 97.6% |
| Immigrants | Iraq | 0.7 /100 | #253 | Tragic 97.6% |
| Immigrants | Congo | 0.7 /100 | #254 | Tragic 97.6% |
| Immigrants | Asia | 0.7 /100 | #255 | Tragic 97.6% |
| Yaqui | 0.6 /100 | #256 | Tragic 97.6% |
| Immigrants | Colombia | 0.6 /100 | #257 | Tragic 97.6% |
| Jamaicans | 0.6 /100 | #258 | Tragic 97.6% |
| Armenians | 0.4 /100 | #259 | Tragic 97.6% |
| Immigrants | South America | 0.4 /100 | #260 | Tragic 97.6% |
| Cubans | 0.4 /100 | #261 | Tragic 97.6% |
| Immigrants | Ethiopia | 0.4 /100 | #262 | Tragic 97.6% |
| Fijians | 0.3 /100 | #263 | Tragic 97.6% |
| Taiwanese | 0.3 /100 | #264 | Tragic 97.6% |
| Assyrians/Chaldeans/Syriacs | 0.3 /100 | #265 | Tragic 97.6% |
Demographics Similar to Tohono O'odham by Nursery School
In terms of nursery school, the demographic groups most similar to Tohono O'odham are Immigrants from Egypt (97.9%, a difference of 0.0%), Immigrants from Lebanon (97.9%, a difference of 0.0%), Guamanian/Chamorro (97.9%, a difference of 0.010%), Yuman (97.9%, a difference of 0.010%), and Immigrants from Kenya (97.9%, a difference of 0.010%).
| Demographics | Rating | Rank | Nursery School |
| Paraguayans | 27.4 /100 | #193 | Fair 97.9% |
| Mongolians | 27.3 /100 | #194 | Fair 97.9% |
| Hawaiians | 27.2 /100 | #195 | Fair 97.9% |
| Guamanians/Chamorros | 25.7 /100 | #196 | Fair 97.9% |
| Yuman | 25.7 /100 | #197 | Fair 97.9% |
| Immigrants | Kenya | 24.1 /100 | #198 | Fair 97.9% |
| Immigrants | Egypt | 22.5 /100 | #199 | Fair 97.9% |
| Tohono O'odham | 22.2 /100 | #200 | Fair 97.9% |
| Immigrants | Lebanon | 21.2 /100 | #201 | Fair 97.9% |
| Immigrants | Ukraine | 19.9 /100 | #202 | Poor 97.9% |
| Immigrants | Uganda | 18.0 /100 | #203 | Poor 97.9% |
| Immigrants | Southern Europe | 17.4 /100 | #204 | Poor 97.9% |
| Immigrants | Chile | 17.3 /100 | #205 | Poor 97.9% |
| Immigrants | Albania | 16.4 /100 | #206 | Poor 97.9% |
| Africans | 15.4 /100 | #207 | Poor 97.9% |