Jamaican vs Immigrants from Ireland Single Father Poverty
COMPARE
Jamaican
Immigrants from Ireland
Single Father Poverty
Single Father Poverty Comparison
Jamaicans
Immigrants from Ireland
17.3%
SINGLE FATHER POVERTY
0.3/ 100
METRIC RATING
266th/ 347
METRIC RANK
17.1%
SINGLE FATHER POVERTY
1.4/ 100
METRIC RATING
246th/ 347
METRIC RANK
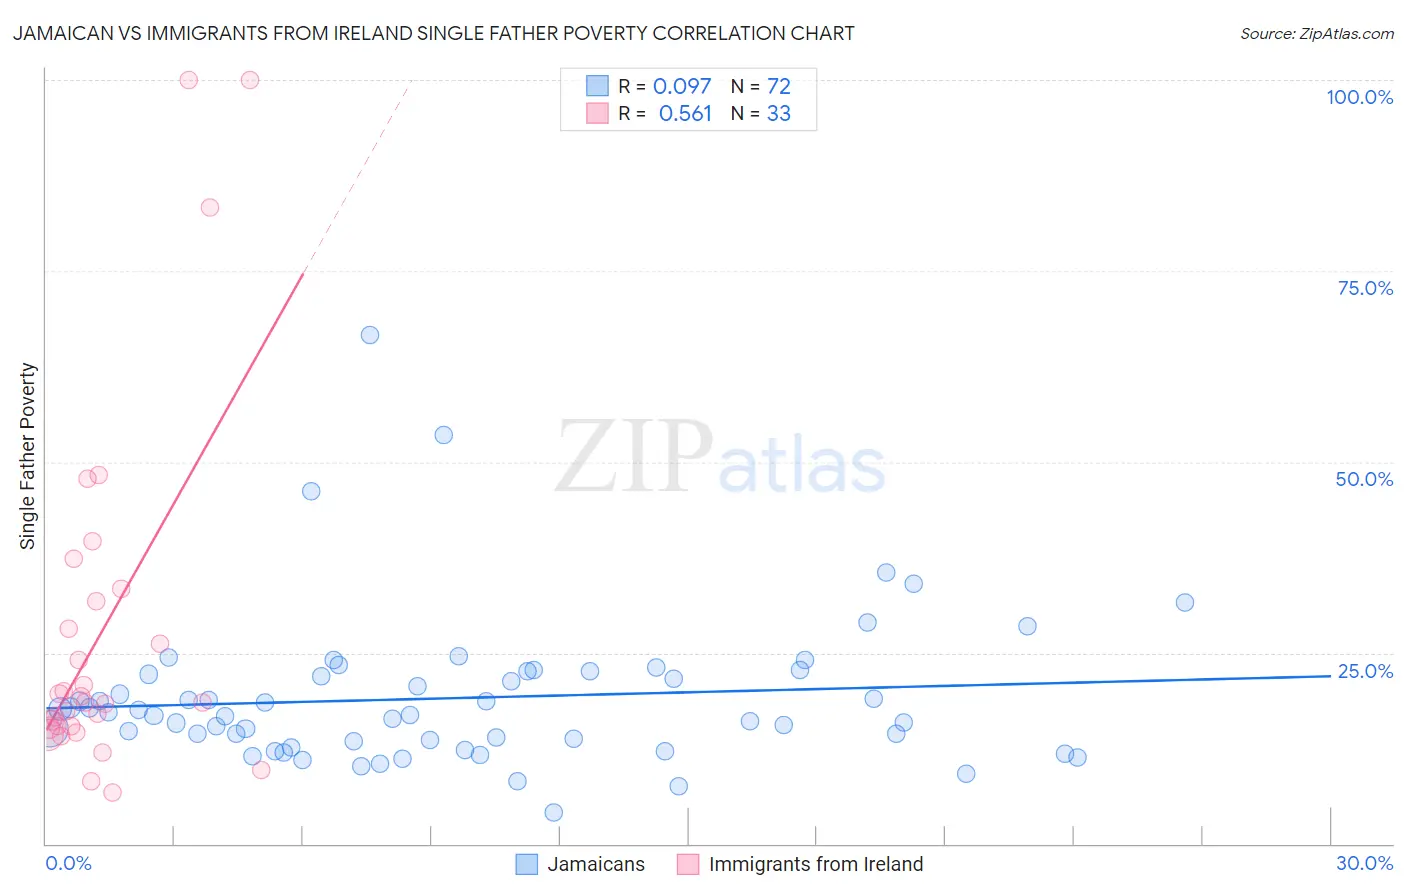
Jamaican vs Immigrants from Ireland Single Father Poverty Correlation Chart
The statistical analysis conducted on geographies consisting of 295,636,374 people shows a slight positive correlation between the proportion of Jamaicans and poverty level among single fathers in the United States with a correlation coefficient (R) of 0.097 and weighted average of 17.3%. Similarly, the statistical analysis conducted on geographies consisting of 193,149,664 people shows a substantial positive correlation between the proportion of Immigrants from Ireland and poverty level among single fathers in the United States with a correlation coefficient (R) of 0.561 and weighted average of 17.1%, a difference of 1.6%.
Single Father Poverty Correlation Summary
| Measurement | Jamaican | Immigrants from Ireland |
| Minimum | 4.1% | 6.7% |
| Maximum | 66.7% | 100.0% |
| Range | 62.6% | 93.3% |
| Mean | 19.1% | 28.1% |
| Median | 17.1% | 18.5% |
| Interquartile 25% (IQ1) | 13.5% | 15.3% |
| Interquartile 75% (IQ3) | 22.4% | 32.6% |
| Interquartile Range (IQR) | 8.8% | 17.3% |
| Standard Deviation (Sample) | 9.8% | 23.7% |
| Standard Deviation (Population) | 9.8% | 23.4% |
Demographics Similar to Jamaicans and Immigrants from Ireland by Single Father Poverty
In terms of single father poverty, the demographic groups most similar to Jamaicans are Slovene (17.3%, a difference of 0.060%), Polish (17.3%, a difference of 0.060%), Lithuanian (17.3%, a difference of 0.26%), Immigrants from Zaire (17.3%, a difference of 0.27%), and Swiss (17.3%, a difference of 0.40%). Similarly, the demographic groups most similar to Immigrants from Ireland are Greek (17.1%, a difference of 0.10%), Czechoslovakian (17.1%, a difference of 0.10%), Canadian (17.1%, a difference of 0.15%), Austrian (17.1%, a difference of 0.28%), and Luxembourger (17.1%, a difference of 0.29%).
| Demographics | Rating | Rank | Single Father Poverty |
| Immigrants | Ireland | 1.4 /100 | #246 | Tragic 17.1% |
| Greeks | 1.3 /100 | #247 | Tragic 17.1% |
| Czechoslovakians | 1.3 /100 | #248 | Tragic 17.1% |
| Canadians | 1.3 /100 | #249 | Tragic 17.1% |
| Austrians | 1.1 /100 | #250 | Tragic 17.1% |
| Luxembourgers | 1.1 /100 | #251 | Tragic 17.1% |
| Croatians | 1.0 /100 | #252 | Tragic 17.1% |
| Cree | 1.0 /100 | #253 | Tragic 17.1% |
| Immigrants | Honduras | 0.9 /100 | #254 | Tragic 17.1% |
| Sierra Leoneans | 0.8 /100 | #255 | Tragic 17.2% |
| Immigrants | Haiti | 0.8 /100 | #256 | Tragic 17.2% |
| Immigrants | Albania | 0.7 /100 | #257 | Tragic 17.2% |
| Albanians | 0.7 /100 | #258 | Tragic 17.2% |
| Immigrants | Jamaica | 0.7 /100 | #259 | Tragic 17.2% |
| Spaniards | 0.6 /100 | #260 | Tragic 17.2% |
| Swiss | 0.5 /100 | #261 | Tragic 17.3% |
| Immigrants | Zaire | 0.4 /100 | #262 | Tragic 17.3% |
| Lithuanians | 0.4 /100 | #263 | Tragic 17.3% |
| Slovenes | 0.3 /100 | #264 | Tragic 17.3% |
| Poles | 0.3 /100 | #265 | Tragic 17.3% |
| Jamaicans | 0.3 /100 | #266 | Tragic 17.3% |