Jamaican vs Immigrants from Africa Single Father Poverty
COMPARE
Jamaican
Immigrants from Africa
Single Father Poverty
Single Father Poverty Comparison
Jamaicans
Immigrants from Africa
17.3%
SINGLE FATHER POVERTY
0.3/ 100
METRIC RATING
266th/ 347
METRIC RANK
15.8%
SINGLE FATHER POVERTY
95.1/ 100
METRIC RATING
110th/ 347
METRIC RANK
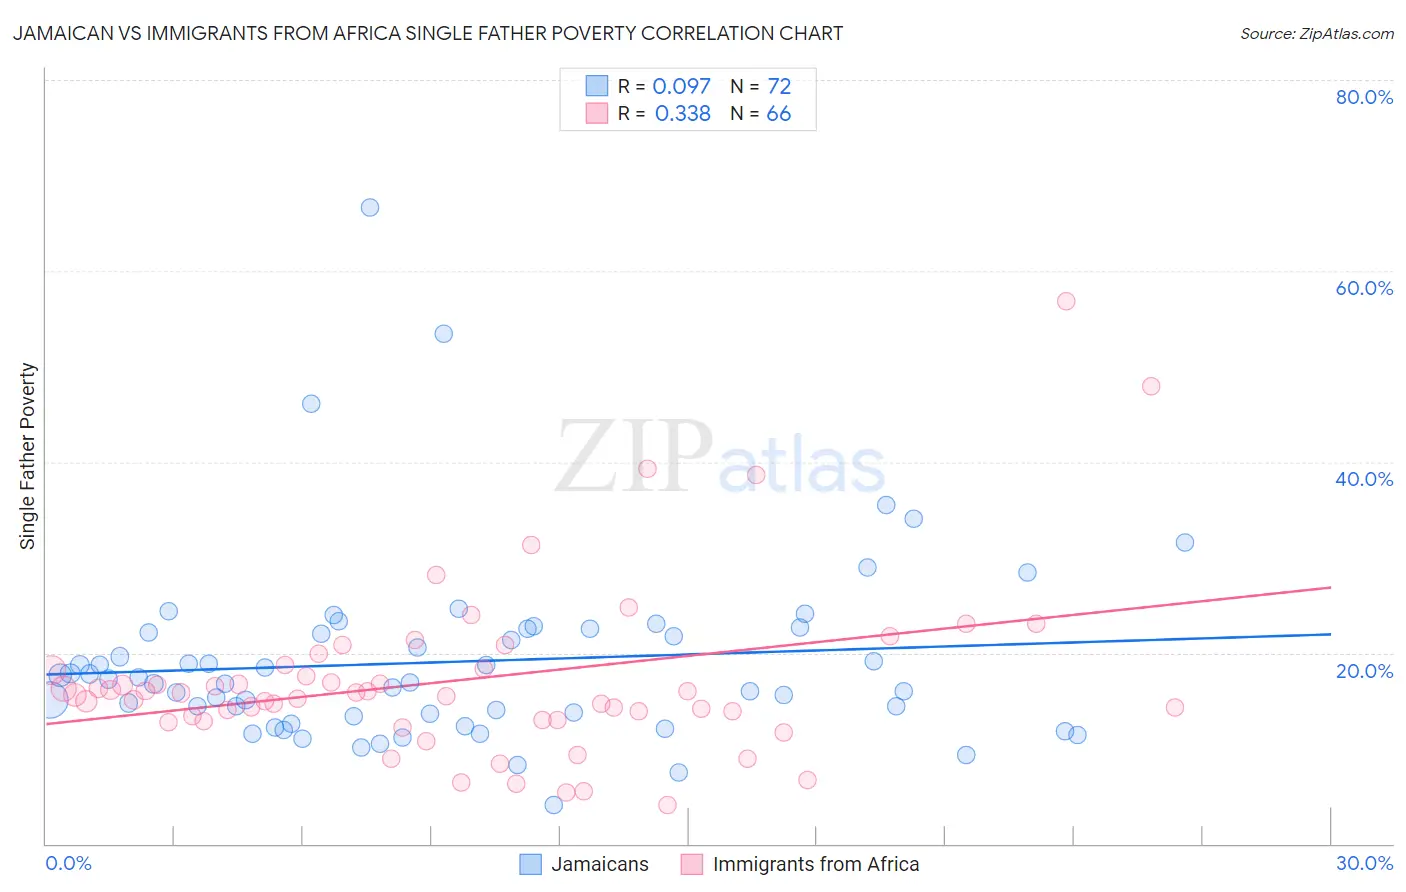
Jamaican vs Immigrants from Africa Single Father Poverty Correlation Chart
The statistical analysis conducted on geographies consisting of 295,636,374 people shows a slight positive correlation between the proportion of Jamaicans and poverty level among single fathers in the United States with a correlation coefficient (R) of 0.097 and weighted average of 17.3%. Similarly, the statistical analysis conducted on geographies consisting of 360,154,757 people shows a mild positive correlation between the proportion of Immigrants from Africa and poverty level among single fathers in the United States with a correlation coefficient (R) of 0.338 and weighted average of 15.8%, a difference of 9.9%.
Single Father Poverty Correlation Summary
| Measurement | Jamaican | Immigrants from Africa |
| Minimum | 4.1% | 4.1% |
| Maximum | 66.7% | 56.8% |
| Range | 62.6% | 52.7% |
| Mean | 19.1% | 17.1% |
| Median | 17.1% | 15.7% |
| Interquartile 25% (IQ1) | 13.5% | 13.0% |
| Interquartile 75% (IQ3) | 22.4% | 18.3% |
| Interquartile Range (IQR) | 8.8% | 5.3% |
| Standard Deviation (Sample) | 9.8% | 9.1% |
| Standard Deviation (Population) | 9.8% | 9.0% |
Similar Demographics by Single Father Poverty
Demographics Similar to Jamaicans by Single Father Poverty
In terms of single father poverty, the demographic groups most similar to Jamaicans are Haitian (17.3%, a difference of 0.040%), Slovene (17.3%, a difference of 0.060%), Polish (17.3%, a difference of 0.060%), Immigrants from Caribbean (17.4%, a difference of 0.14%), and Slavic (17.4%, a difference of 0.21%).
| Demographics | Rating | Rank | Single Father Poverty |
| Immigrants | Jamaica | 0.7 /100 | #259 | Tragic 17.2% |
| Spaniards | 0.6 /100 | #260 | Tragic 17.2% |
| Swiss | 0.5 /100 | #261 | Tragic 17.3% |
| Immigrants | Zaire | 0.4 /100 | #262 | Tragic 17.3% |
| Lithuanians | 0.4 /100 | #263 | Tragic 17.3% |
| Slovenes | 0.3 /100 | #264 | Tragic 17.3% |
| Poles | 0.3 /100 | #265 | Tragic 17.3% |
| Jamaicans | 0.3 /100 | #266 | Tragic 17.3% |
| Haitians | 0.3 /100 | #267 | Tragic 17.3% |
| Immigrants | Caribbean | 0.3 /100 | #268 | Tragic 17.4% |
| Slavs | 0.3 /100 | #269 | Tragic 17.4% |
| Indonesians | 0.2 /100 | #270 | Tragic 17.4% |
| French American Indians | 0.2 /100 | #271 | Tragic 17.4% |
| Barbadians | 0.1 /100 | #272 | Tragic 17.5% |
| Italians | 0.1 /100 | #273 | Tragic 17.5% |
Demographics Similar to Immigrants from Africa by Single Father Poverty
In terms of single father poverty, the demographic groups most similar to Immigrants from Africa are Turkish (15.8%, a difference of 0.010%), Bulgarian (15.8%, a difference of 0.050%), Immigrants from Latvia (15.8%, a difference of 0.080%), Danish (15.8%, a difference of 0.13%), and Argentinean (15.8%, a difference of 0.14%).
| Demographics | Rating | Rank | Single Father Poverty |
| South American Indians | 96.2 /100 | #103 | Exceptional 15.7% |
| Australians | 96.1 /100 | #104 | Exceptional 15.7% |
| Immigrants | Australia | 96.1 /100 | #105 | Exceptional 15.7% |
| Immigrants | Poland | 95.8 /100 | #106 | Exceptional 15.7% |
| Native Hawaiians | 95.8 /100 | #107 | Exceptional 15.7% |
| Pakistanis | 95.7 /100 | #108 | Exceptional 15.7% |
| Turks | 95.1 /100 | #109 | Exceptional 15.8% |
| Immigrants | Africa | 95.1 /100 | #110 | Exceptional 15.8% |
| Bulgarians | 94.8 /100 | #111 | Exceptional 15.8% |
| Immigrants | Latvia | 94.7 /100 | #112 | Exceptional 15.8% |
| Danes | 94.5 /100 | #113 | Exceptional 15.8% |
| Argentineans | 94.4 /100 | #114 | Exceptional 15.8% |
| Immigrants | Thailand | 93.6 /100 | #115 | Exceptional 15.8% |
| Immigrants | Argentina | 92.8 /100 | #116 | Exceptional 15.8% |
| Immigrants | Colombia | 92.6 /100 | #117 | Exceptional 15.8% |