Jamaican vs Immigrants from Sweden Single Father Poverty
COMPARE
Jamaican
Immigrants from Sweden
Single Father Poverty
Single Father Poverty Comparison
Jamaicans
Immigrants from Sweden
17.3%
SINGLE FATHER POVERTY
0.3/ 100
METRIC RATING
266th/ 347
METRIC RANK
15.2%
SINGLE FATHER POVERTY
99.8/ 100
METRIC RATING
63rd/ 347
METRIC RANK
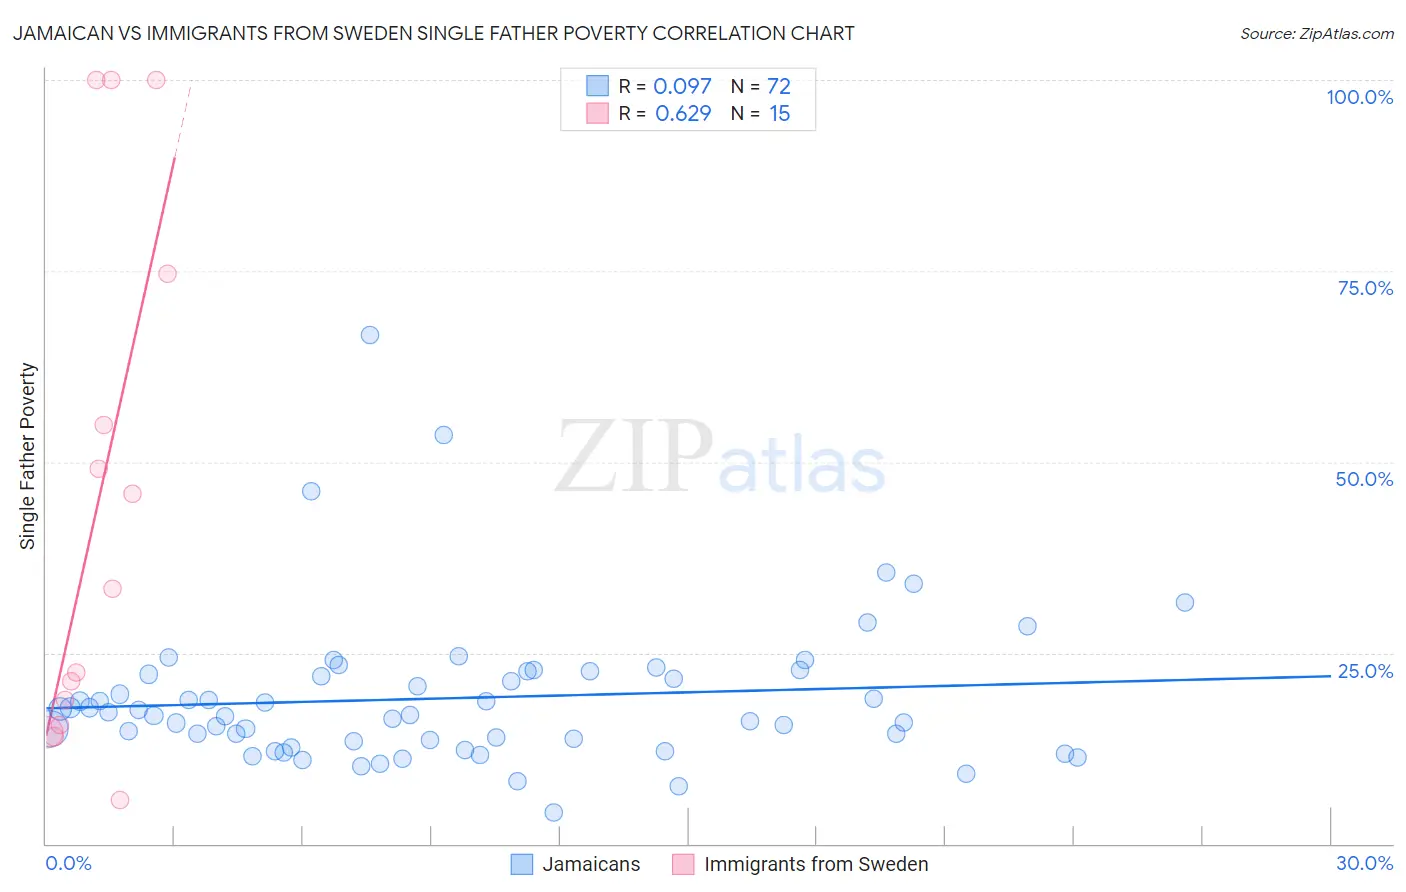
Jamaican vs Immigrants from Sweden Single Father Poverty Correlation Chart
The statistical analysis conducted on geographies consisting of 295,636,374 people shows a slight positive correlation between the proportion of Jamaicans and poverty level among single fathers in the United States with a correlation coefficient (R) of 0.097 and weighted average of 17.3%. Similarly, the statistical analysis conducted on geographies consisting of 139,123,706 people shows a significant positive correlation between the proportion of Immigrants from Sweden and poverty level among single fathers in the United States with a correlation coefficient (R) of 0.629 and weighted average of 15.2%, a difference of 14.2%.
Single Father Poverty Correlation Summary
| Measurement | Jamaican | Immigrants from Sweden |
| Minimum | 4.1% | 5.8% |
| Maximum | 66.7% | 100.0% |
| Range | 62.6% | 94.2% |
| Mean | 19.1% | 44.7% |
| Median | 17.1% | 33.3% |
| Interquartile 25% (IQ1) | 13.5% | 15.5% |
| Interquartile 75% (IQ3) | 22.4% | 74.7% |
| Interquartile Range (IQR) | 8.8% | 59.2% |
| Standard Deviation (Sample) | 9.8% | 34.1% |
| Standard Deviation (Population) | 9.8% | 32.9% |
Similar Demographics by Single Father Poverty
Demographics Similar to Jamaicans by Single Father Poverty
In terms of single father poverty, the demographic groups most similar to Jamaicans are Haitian (17.3%, a difference of 0.040%), Slovene (17.3%, a difference of 0.060%), Polish (17.3%, a difference of 0.060%), Immigrants from Caribbean (17.4%, a difference of 0.14%), and Slavic (17.4%, a difference of 0.21%).
| Demographics | Rating | Rank | Single Father Poverty |
| Immigrants | Jamaica | 0.7 /100 | #259 | Tragic 17.2% |
| Spaniards | 0.6 /100 | #260 | Tragic 17.2% |
| Swiss | 0.5 /100 | #261 | Tragic 17.3% |
| Immigrants | Zaire | 0.4 /100 | #262 | Tragic 17.3% |
| Lithuanians | 0.4 /100 | #263 | Tragic 17.3% |
| Slovenes | 0.3 /100 | #264 | Tragic 17.3% |
| Poles | 0.3 /100 | #265 | Tragic 17.3% |
| Jamaicans | 0.3 /100 | #266 | Tragic 17.3% |
| Haitians | 0.3 /100 | #267 | Tragic 17.3% |
| Immigrants | Caribbean | 0.3 /100 | #268 | Tragic 17.4% |
| Slavs | 0.3 /100 | #269 | Tragic 17.4% |
| Indonesians | 0.2 /100 | #270 | Tragic 17.4% |
| French American Indians | 0.2 /100 | #271 | Tragic 17.4% |
| Barbadians | 0.1 /100 | #272 | Tragic 17.5% |
| Italians | 0.1 /100 | #273 | Tragic 17.5% |
Demographics Similar to Immigrants from Sweden by Single Father Poverty
In terms of single father poverty, the demographic groups most similar to Immigrants from Sweden are Bangladeshi (15.2%, a difference of 0.080%), Immigrants from Armenia (15.2%, a difference of 0.090%), Immigrants from Bosnia and Herzegovina (15.2%, a difference of 0.10%), Puget Sound Salish (15.2%, a difference of 0.14%), and Immigrants from Malaysia (15.2%, a difference of 0.16%).
| Demographics | Rating | Rank | Single Father Poverty |
| Immigrants | Laos | 99.9 /100 | #56 | Exceptional 15.1% |
| Laotians | 99.9 /100 | #57 | Exceptional 15.1% |
| Hawaiians | 99.9 /100 | #58 | Exceptional 15.1% |
| Guamanians/Chamorros | 99.9 /100 | #59 | Exceptional 15.1% |
| Puget Sound Salish | 99.8 /100 | #60 | Exceptional 15.2% |
| Immigrants | Bosnia and Herzegovina | 99.8 /100 | #61 | Exceptional 15.2% |
| Immigrants | Armenia | 99.8 /100 | #62 | Exceptional 15.2% |
| Immigrants | Sweden | 99.8 /100 | #63 | Exceptional 15.2% |
| Bangladeshis | 99.8 /100 | #64 | Exceptional 15.2% |
| Immigrants | Malaysia | 99.8 /100 | #65 | Exceptional 15.2% |
| Immigrants | Moldova | 99.8 /100 | #66 | Exceptional 15.2% |
| Paraguayans | 99.7 /100 | #67 | Exceptional 15.2% |
| Immigrants | Cameroon | 99.7 /100 | #68 | Exceptional 15.2% |
| Japanese | 99.7 /100 | #69 | Exceptional 15.2% |
| Mongolians | 99.7 /100 | #70 | Exceptional 15.3% |