Jamaican vs U.S. Virgin Islander Single Father Poverty
COMPARE
Jamaican
U.S. Virgin Islander
Single Father Poverty
Single Father Poverty Comparison
Jamaicans
U.S. Virgin Islanders
17.3%
SINGLE FATHER POVERTY
0.3/ 100
METRIC RATING
266th/ 347
METRIC RANK
18.1%
SINGLE FATHER POVERTY
0.0/ 100
METRIC RATING
294th/ 347
METRIC RANK
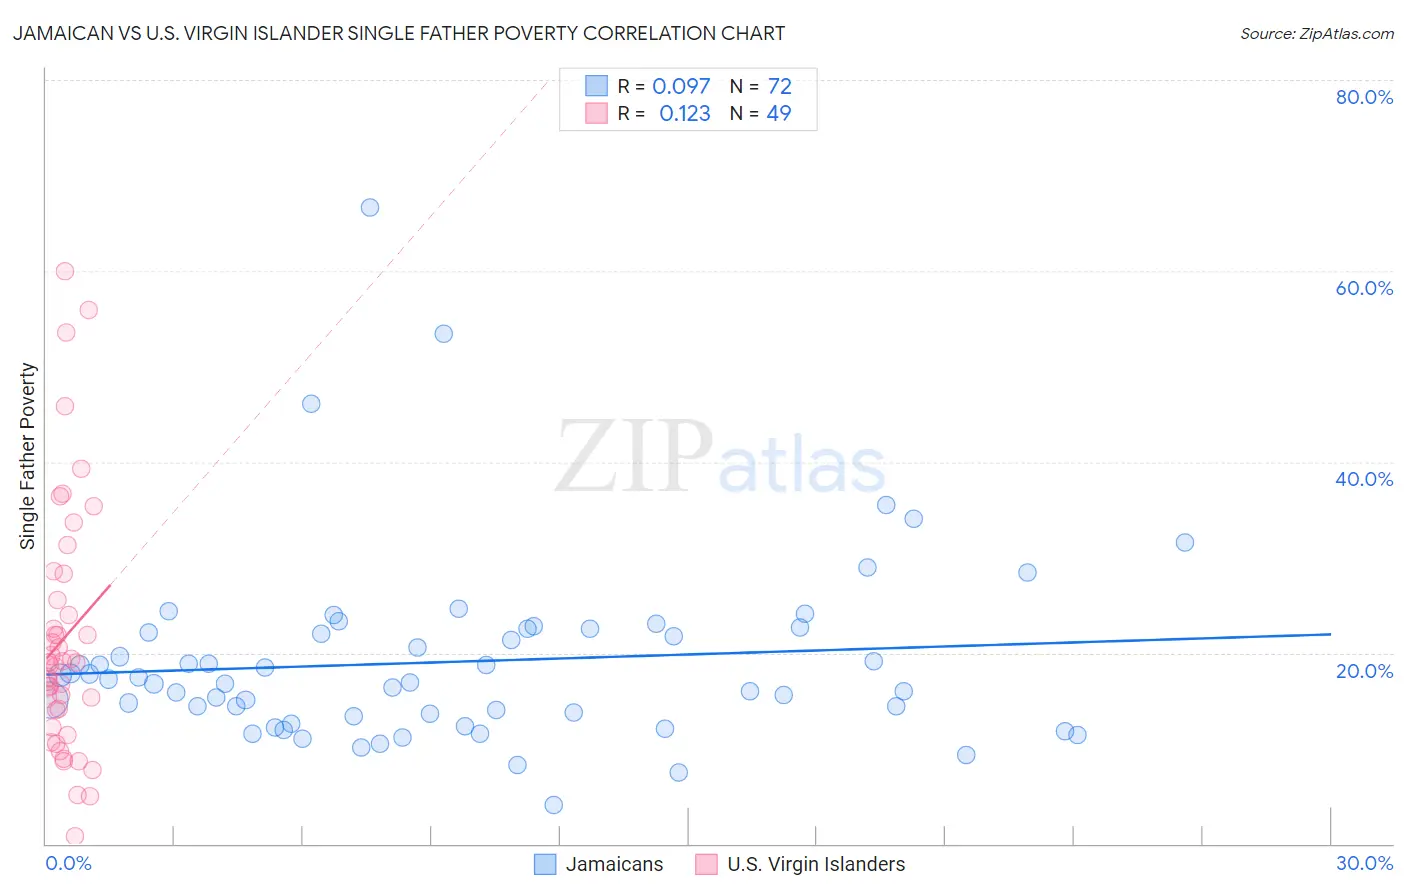
Jamaican vs U.S. Virgin Islander Single Father Poverty Correlation Chart
The statistical analysis conducted on geographies consisting of 295,636,374 people shows a slight positive correlation between the proportion of Jamaicans and poverty level among single fathers in the United States with a correlation coefficient (R) of 0.097 and weighted average of 17.3%. Similarly, the statistical analysis conducted on geographies consisting of 82,675,302 people shows a poor positive correlation between the proportion of U.S. Virgin Islanders and poverty level among single fathers in the United States with a correlation coefficient (R) of 0.123 and weighted average of 18.1%, a difference of 4.5%.
Single Father Poverty Correlation Summary
| Measurement | Jamaican | U.S. Virgin Islander |
| Minimum | 4.1% | 0.75% |
| Maximum | 66.7% | 60.0% |
| Range | 62.6% | 59.2% |
| Mean | 19.1% | 21.5% |
| Median | 17.1% | 19.0% |
| Interquartile 25% (IQ1) | 13.5% | 13.1% |
| Interquartile 75% (IQ3) | 22.4% | 26.9% |
| Interquartile Range (IQR) | 8.8% | 13.8% |
| Standard Deviation (Sample) | 9.8% | 13.1% |
| Standard Deviation (Population) | 9.8% | 12.9% |
Similar Demographics by Single Father Poverty
Demographics Similar to Jamaicans by Single Father Poverty
In terms of single father poverty, the demographic groups most similar to Jamaicans are Haitian (17.3%, a difference of 0.040%), Slovene (17.3%, a difference of 0.060%), Polish (17.3%, a difference of 0.060%), Immigrants from Caribbean (17.4%, a difference of 0.14%), and Slavic (17.4%, a difference of 0.21%).
| Demographics | Rating | Rank | Single Father Poverty |
| Immigrants | Jamaica | 0.7 /100 | #259 | Tragic 17.2% |
| Spaniards | 0.6 /100 | #260 | Tragic 17.2% |
| Swiss | 0.5 /100 | #261 | Tragic 17.3% |
| Immigrants | Zaire | 0.4 /100 | #262 | Tragic 17.3% |
| Lithuanians | 0.4 /100 | #263 | Tragic 17.3% |
| Slovenes | 0.3 /100 | #264 | Tragic 17.3% |
| Poles | 0.3 /100 | #265 | Tragic 17.3% |
| Jamaicans | 0.3 /100 | #266 | Tragic 17.3% |
| Haitians | 0.3 /100 | #267 | Tragic 17.3% |
| Immigrants | Caribbean | 0.3 /100 | #268 | Tragic 17.4% |
| Slavs | 0.3 /100 | #269 | Tragic 17.4% |
| Indonesians | 0.2 /100 | #270 | Tragic 17.4% |
| French American Indians | 0.2 /100 | #271 | Tragic 17.4% |
| Barbadians | 0.1 /100 | #272 | Tragic 17.5% |
| Italians | 0.1 /100 | #273 | Tragic 17.5% |
Demographics Similar to U.S. Virgin Islanders by Single Father Poverty
In terms of single father poverty, the demographic groups most similar to U.S. Virgin Islanders are Alaska Native (18.1%, a difference of 0.030%), Yakama (18.1%, a difference of 0.060%), Immigrants from Bahamas (18.1%, a difference of 0.13%), Alaskan Athabascan (18.1%, a difference of 0.14%), and Seminole (18.1%, a difference of 0.17%).
| Demographics | Rating | Rank | Single Father Poverty |
| Carpatho Rusyns | 0.0 /100 | #287 | Tragic 18.0% |
| Bahamians | 0.0 /100 | #288 | Tragic 18.0% |
| Irish | 0.0 /100 | #289 | Tragic 18.0% |
| West Indians | 0.0 /100 | #290 | Tragic 18.0% |
| Alaskan Athabascans | 0.0 /100 | #291 | Tragic 18.1% |
| Immigrants | Bahamas | 0.0 /100 | #292 | Tragic 18.1% |
| Alaska Natives | 0.0 /100 | #293 | Tragic 18.1% |
| U.S. Virgin Islanders | 0.0 /100 | #294 | Tragic 18.1% |
| Yakama | 0.0 /100 | #295 | Tragic 18.1% |
| Seminole | 0.0 /100 | #296 | Tragic 18.1% |
| French | 0.0 /100 | #297 | Tragic 18.2% |
| Africans | 0.0 /100 | #298 | Tragic 18.3% |
| Whites/Caucasians | 0.0 /100 | #299 | Tragic 18.4% |
| Immigrants | Dominican Republic | 0.0 /100 | #300 | Tragic 18.4% |
| Hungarians | 0.0 /100 | #301 | Tragic 18.5% |