Jamaican vs Asian Single Father Poverty
COMPARE
Jamaican
Asian
Single Father Poverty
Single Father Poverty Comparison
Jamaicans
Asians
17.3%
SINGLE FATHER POVERTY
0.3/ 100
METRIC RATING
266th/ 347
METRIC RANK
14.6%
SINGLE FATHER POVERTY
100.0/ 100
METRIC RATING
32nd/ 347
METRIC RANK
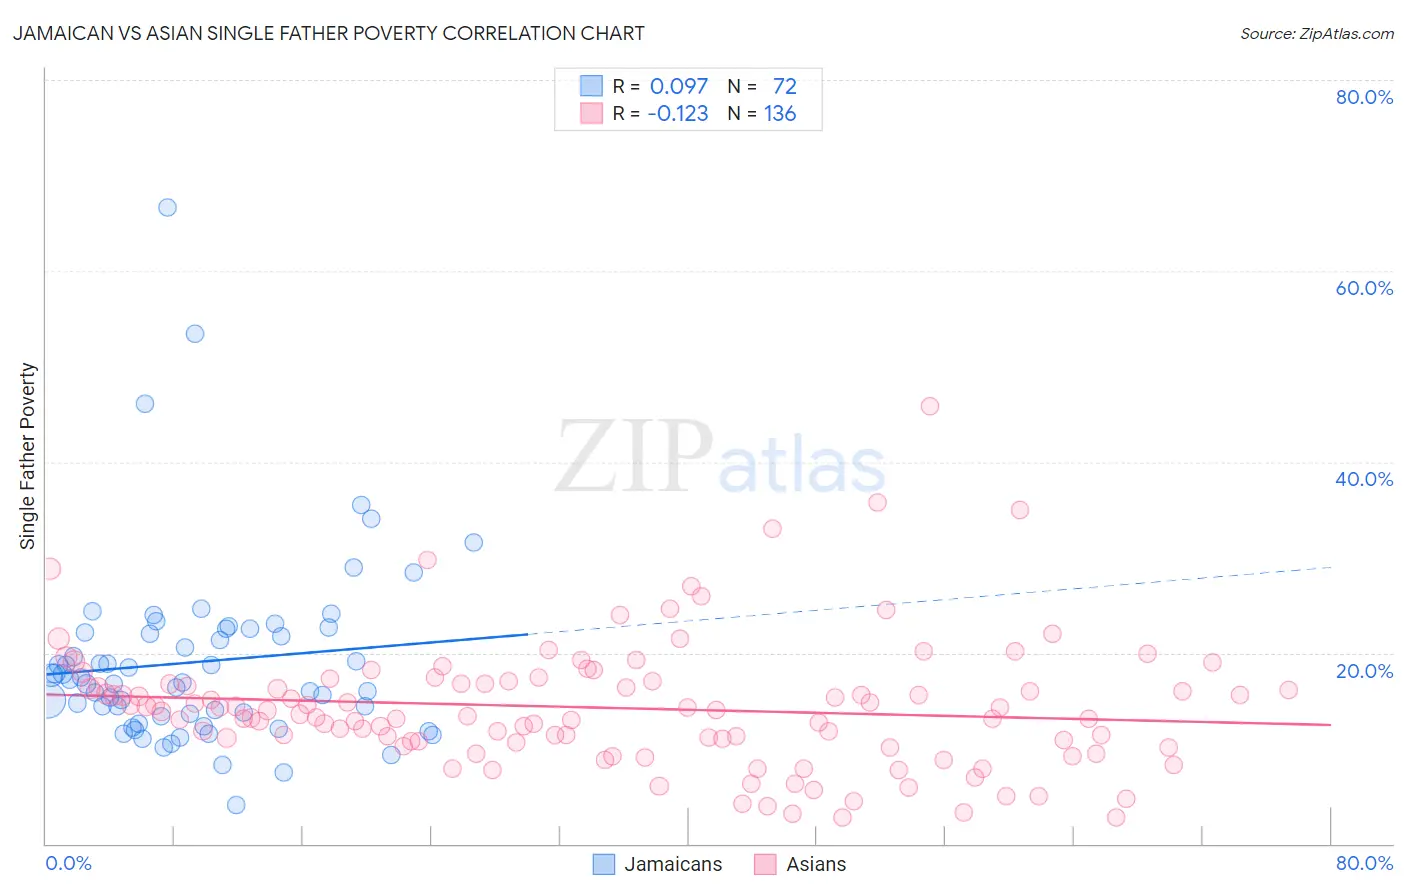
Jamaican vs Asian Single Father Poverty Correlation Chart
The statistical analysis conducted on geographies consisting of 295,636,374 people shows a slight positive correlation between the proportion of Jamaicans and poverty level among single fathers in the United States with a correlation coefficient (R) of 0.097 and weighted average of 17.3%. Similarly, the statistical analysis conducted on geographies consisting of 402,614,567 people shows a poor negative correlation between the proportion of Asians and poverty level among single fathers in the United States with a correlation coefficient (R) of -0.123 and weighted average of 14.6%, a difference of 19.0%.
Single Father Poverty Correlation Summary
| Measurement | Jamaican | Asian |
| Minimum | 4.1% | 2.7% |
| Maximum | 66.7% | 45.8% |
| Range | 62.6% | 43.1% |
| Mean | 19.1% | 14.3% |
| Median | 17.1% | 13.7% |
| Interquartile 25% (IQ1) | 13.5% | 10.7% |
| Interquartile 75% (IQ3) | 22.4% | 16.8% |
| Interquartile Range (IQR) | 8.8% | 6.1% |
| Standard Deviation (Sample) | 9.8% | 6.7% |
| Standard Deviation (Population) | 9.8% | 6.7% |
Similar Demographics by Single Father Poverty
Demographics Similar to Jamaicans by Single Father Poverty
In terms of single father poverty, the demographic groups most similar to Jamaicans are Haitian (17.3%, a difference of 0.040%), Slovene (17.3%, a difference of 0.060%), Polish (17.3%, a difference of 0.060%), Immigrants from Caribbean (17.4%, a difference of 0.14%), and Slavic (17.4%, a difference of 0.21%).
| Demographics | Rating | Rank | Single Father Poverty |
| Immigrants | Jamaica | 0.7 /100 | #259 | Tragic 17.2% |
| Spaniards | 0.6 /100 | #260 | Tragic 17.2% |
| Swiss | 0.5 /100 | #261 | Tragic 17.3% |
| Immigrants | Zaire | 0.4 /100 | #262 | Tragic 17.3% |
| Lithuanians | 0.4 /100 | #263 | Tragic 17.3% |
| Slovenes | 0.3 /100 | #264 | Tragic 17.3% |
| Poles | 0.3 /100 | #265 | Tragic 17.3% |
| Jamaicans | 0.3 /100 | #266 | Tragic 17.3% |
| Haitians | 0.3 /100 | #267 | Tragic 17.3% |
| Immigrants | Caribbean | 0.3 /100 | #268 | Tragic 17.4% |
| Slavs | 0.3 /100 | #269 | Tragic 17.4% |
| Indonesians | 0.2 /100 | #270 | Tragic 17.4% |
| French American Indians | 0.2 /100 | #271 | Tragic 17.4% |
| Barbadians | 0.1 /100 | #272 | Tragic 17.5% |
| Italians | 0.1 /100 | #273 | Tragic 17.5% |
Demographics Similar to Asians by Single Father Poverty
In terms of single father poverty, the demographic groups most similar to Asians are Icelander (14.5%, a difference of 0.15%), Thai (14.5%, a difference of 0.24%), Somali (14.5%, a difference of 0.28%), Immigrants from South Central Asia (14.5%, a difference of 0.38%), and Okinawan (14.6%, a difference of 0.56%).
| Demographics | Rating | Rank | Single Father Poverty |
| Iranians | 100.0 /100 | #25 | Exceptional 14.4% |
| Spanish American Indians | 100.0 /100 | #26 | Exceptional 14.4% |
| Nepalese | 100.0 /100 | #27 | Exceptional 14.4% |
| Immigrants | South Central Asia | 100.0 /100 | #28 | Exceptional 14.5% |
| Somalis | 100.0 /100 | #29 | Exceptional 14.5% |
| Thais | 100.0 /100 | #30 | Exceptional 14.5% |
| Icelanders | 100.0 /100 | #31 | Exceptional 14.5% |
| Asians | 100.0 /100 | #32 | Exceptional 14.6% |
| Okinawans | 100.0 /100 | #33 | Exceptional 14.6% |
| Egyptians | 100.0 /100 | #34 | Exceptional 14.7% |
| Immigrants | Bolivia | 100.0 /100 | #35 | Exceptional 14.7% |
| Immigrants | Indonesia | 100.0 /100 | #36 | Exceptional 14.7% |
| Immigrants | Eastern Africa | 100.0 /100 | #37 | Exceptional 14.7% |
| Bolivians | 100.0 /100 | #38 | Exceptional 14.7% |
| Immigrants | Asia | 100.0 /100 | #39 | Exceptional 14.7% |