Jamaican vs Native/Alaskan Single Father Poverty
COMPARE
Jamaican
Native/Alaskan
Single Father Poverty
Single Father Poverty Comparison
Jamaicans
Natives/Alaskans
17.3%
SINGLE FATHER POVERTY
0.3/ 100
METRIC RATING
266th/ 347
METRIC RANK
22.4%
SINGLE FATHER POVERTY
0.0/ 100
METRIC RATING
333rd/ 347
METRIC RANK
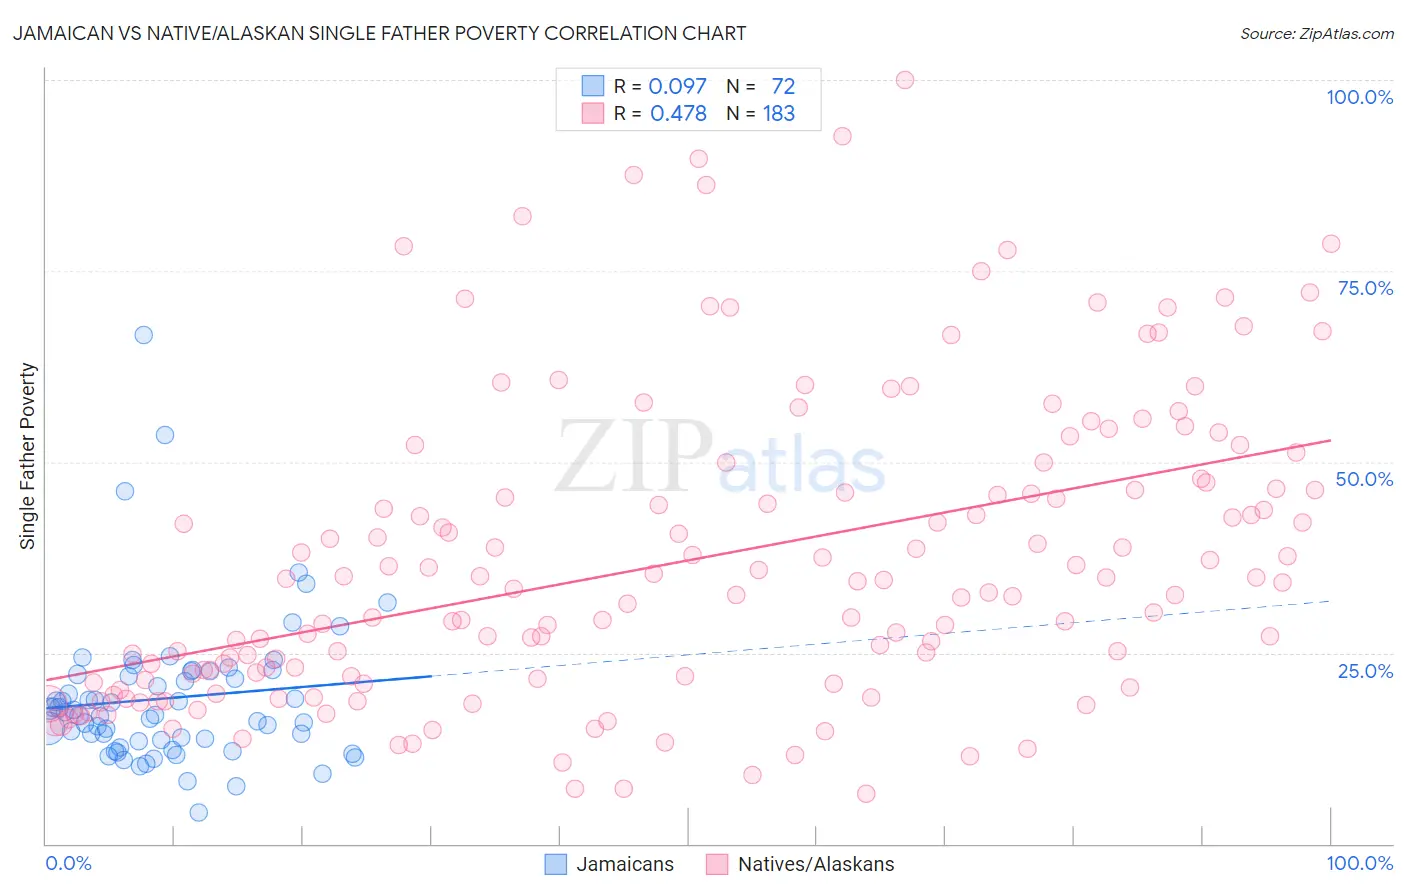
Jamaican vs Native/Alaskan Single Father Poverty Correlation Chart
The statistical analysis conducted on geographies consisting of 295,636,374 people shows a slight positive correlation between the proportion of Jamaicans and poverty level among single fathers in the United States with a correlation coefficient (R) of 0.097 and weighted average of 17.3%. Similarly, the statistical analysis conducted on geographies consisting of 389,194,675 people shows a moderate positive correlation between the proportion of Natives/Alaskans and poverty level among single fathers in the United States with a correlation coefficient (R) of 0.478 and weighted average of 22.4%, a difference of 29.2%.
Single Father Poverty Correlation Summary
| Measurement | Jamaican | Native/Alaskan |
| Minimum | 4.1% | 6.5% |
| Maximum | 66.7% | 100.0% |
| Range | 62.6% | 93.5% |
| Mean | 19.1% | 37.0% |
| Median | 17.1% | 33.3% |
| Interquartile 25% (IQ1) | 13.5% | 21.4% |
| Interquartile 75% (IQ3) | 22.4% | 46.5% |
| Interquartile Range (IQR) | 8.8% | 25.1% |
| Standard Deviation (Sample) | 9.8% | 19.7% |
| Standard Deviation (Population) | 9.8% | 19.7% |
Similar Demographics by Single Father Poverty
Demographics Similar to Jamaicans by Single Father Poverty
In terms of single father poverty, the demographic groups most similar to Jamaicans are Haitian (17.3%, a difference of 0.040%), Slovene (17.3%, a difference of 0.060%), Polish (17.3%, a difference of 0.060%), Immigrants from Caribbean (17.4%, a difference of 0.14%), and Slavic (17.4%, a difference of 0.21%).
| Demographics | Rating | Rank | Single Father Poverty |
| Immigrants | Jamaica | 0.7 /100 | #259 | Tragic 17.2% |
| Spaniards | 0.6 /100 | #260 | Tragic 17.2% |
| Swiss | 0.5 /100 | #261 | Tragic 17.3% |
| Immigrants | Zaire | 0.4 /100 | #262 | Tragic 17.3% |
| Lithuanians | 0.4 /100 | #263 | Tragic 17.3% |
| Slovenes | 0.3 /100 | #264 | Tragic 17.3% |
| Poles | 0.3 /100 | #265 | Tragic 17.3% |
| Jamaicans | 0.3 /100 | #266 | Tragic 17.3% |
| Haitians | 0.3 /100 | #267 | Tragic 17.3% |
| Immigrants | Caribbean | 0.3 /100 | #268 | Tragic 17.4% |
| Slavs | 0.3 /100 | #269 | Tragic 17.4% |
| Indonesians | 0.2 /100 | #270 | Tragic 17.4% |
| French American Indians | 0.2 /100 | #271 | Tragic 17.4% |
| Barbadians | 0.1 /100 | #272 | Tragic 17.5% |
| Italians | 0.1 /100 | #273 | Tragic 17.5% |
Demographics Similar to Natives/Alaskans by Single Father Poverty
In terms of single father poverty, the demographic groups most similar to Natives/Alaskans are Kiowa (22.5%, a difference of 0.36%), Tohono O'odham (22.0%, a difference of 1.7%), Shoshone (22.9%, a difference of 2.3%), Cajun (23.1%, a difference of 3.0%), and Central American Indian (21.7%, a difference of 3.3%).
| Demographics | Rating | Rank | Single Father Poverty |
| Immigrants | Yemen | 0.0 /100 | #326 | Tragic 20.6% |
| Choctaw | 0.0 /100 | #327 | Tragic 20.7% |
| Pueblo | 0.0 /100 | #328 | Tragic 21.1% |
| Colville | 0.0 /100 | #329 | Tragic 21.4% |
| Paiute | 0.0 /100 | #330 | Tragic 21.6% |
| Central American Indians | 0.0 /100 | #331 | Tragic 21.7% |
| Tohono O'odham | 0.0 /100 | #332 | Tragic 22.0% |
| Natives/Alaskans | 0.0 /100 | #333 | Tragic 22.4% |
| Kiowa | 0.0 /100 | #334 | Tragic 22.5% |
| Shoshone | 0.0 /100 | #335 | Tragic 22.9% |
| Cajuns | 0.0 /100 | #336 | Tragic 23.1% |
| Sioux | 0.0 /100 | #337 | Tragic 23.9% |
| Arapaho | 0.0 /100 | #338 | Tragic 24.0% |
| Apache | 0.0 /100 | #339 | Tragic 24.2% |
| Houma | 0.0 /100 | #340 | Tragic 26.7% |