Jamaican vs Immigrants from Europe Single Father Poverty
COMPARE
Jamaican
Immigrants from Europe
Single Father Poverty
Single Father Poverty Comparison
Jamaicans
Immigrants from Europe
17.3%
SINGLE FATHER POVERTY
0.3/ 100
METRIC RATING
266th/ 347
METRIC RANK
16.3%
SINGLE FATHER POVERTY
54.8/ 100
METRIC RATING
166th/ 347
METRIC RANK
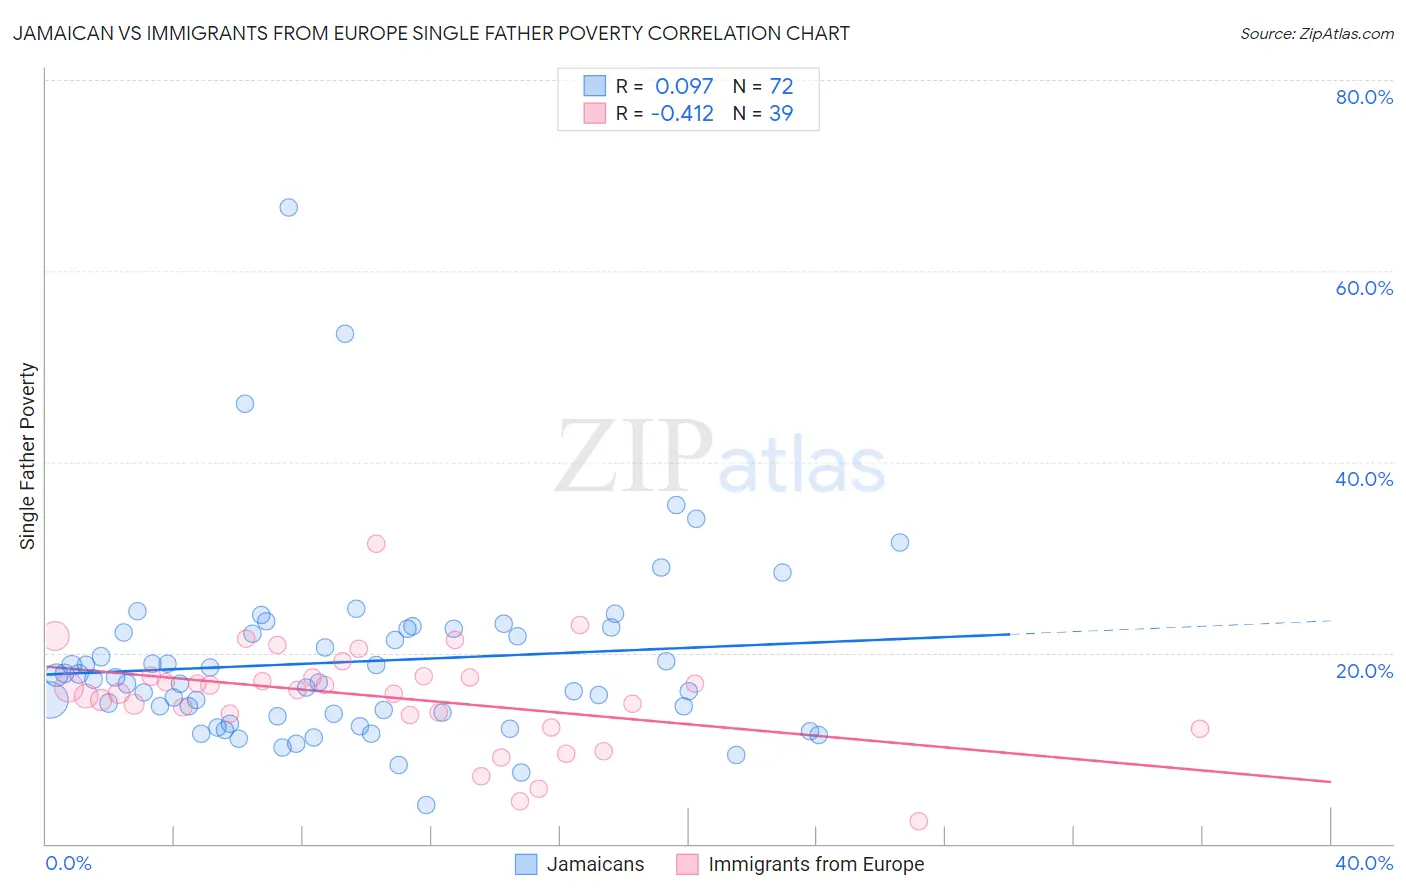
Jamaican vs Immigrants from Europe Single Father Poverty Correlation Chart
The statistical analysis conducted on geographies consisting of 295,636,374 people shows a slight positive correlation between the proportion of Jamaicans and poverty level among single fathers in the United States with a correlation coefficient (R) of 0.097 and weighted average of 17.3%. Similarly, the statistical analysis conducted on geographies consisting of 399,898,147 people shows a moderate negative correlation between the proportion of Immigrants from Europe and poverty level among single fathers in the United States with a correlation coefficient (R) of -0.412 and weighted average of 16.3%, a difference of 6.6%.
Single Father Poverty Correlation Summary
| Measurement | Jamaican | Immigrants from Europe |
| Minimum | 4.1% | 2.4% |
| Maximum | 66.7% | 31.4% |
| Range | 62.6% | 29.0% |
| Mean | 19.1% | 15.4% |
| Median | 17.1% | 16.1% |
| Interquartile 25% (IQ1) | 13.5% | 13.5% |
| Interquartile 75% (IQ3) | 22.4% | 17.5% |
| Interquartile Range (IQR) | 8.8% | 4.0% |
| Standard Deviation (Sample) | 9.8% | 5.4% |
| Standard Deviation (Population) | 9.8% | 5.4% |
Similar Demographics by Single Father Poverty
Demographics Similar to Jamaicans by Single Father Poverty
In terms of single father poverty, the demographic groups most similar to Jamaicans are Haitian (17.3%, a difference of 0.040%), Slovene (17.3%, a difference of 0.060%), Polish (17.3%, a difference of 0.060%), Immigrants from Caribbean (17.4%, a difference of 0.14%), and Slavic (17.4%, a difference of 0.21%).
| Demographics | Rating | Rank | Single Father Poverty |
| Immigrants | Jamaica | 0.7 /100 | #259 | Tragic 17.2% |
| Spaniards | 0.6 /100 | #260 | Tragic 17.2% |
| Swiss | 0.5 /100 | #261 | Tragic 17.3% |
| Immigrants | Zaire | 0.4 /100 | #262 | Tragic 17.3% |
| Lithuanians | 0.4 /100 | #263 | Tragic 17.3% |
| Slovenes | 0.3 /100 | #264 | Tragic 17.3% |
| Poles | 0.3 /100 | #265 | Tragic 17.3% |
| Jamaicans | 0.3 /100 | #266 | Tragic 17.3% |
| Haitians | 0.3 /100 | #267 | Tragic 17.3% |
| Immigrants | Caribbean | 0.3 /100 | #268 | Tragic 17.4% |
| Slavs | 0.3 /100 | #269 | Tragic 17.4% |
| Indonesians | 0.2 /100 | #270 | Tragic 17.4% |
| French American Indians | 0.2 /100 | #271 | Tragic 17.4% |
| Barbadians | 0.1 /100 | #272 | Tragic 17.5% |
| Italians | 0.1 /100 | #273 | Tragic 17.5% |
Demographics Similar to Immigrants from Europe by Single Father Poverty
In terms of single father poverty, the demographic groups most similar to Immigrants from Europe are Guyanese (16.3%, a difference of 0.010%), Immigrants from Bangladesh (16.3%, a difference of 0.010%), Immigrants from Costa Rica (16.3%, a difference of 0.040%), Yugoslavian (16.3%, a difference of 0.040%), and Ugandan (16.3%, a difference of 0.050%).
| Demographics | Rating | Rank | Single Father Poverty |
| Belizeans | 59.9 /100 | #159 | Average 16.2% |
| Immigrants | Sudan | 59.8 /100 | #160 | Average 16.2% |
| Estonians | 56.7 /100 | #161 | Average 16.2% |
| Ugandans | 55.9 /100 | #162 | Average 16.3% |
| Immigrants | Costa Rica | 55.7 /100 | #163 | Average 16.3% |
| Guyanese | 55.2 /100 | #164 | Average 16.3% |
| Immigrants | Bangladesh | 55.1 /100 | #165 | Average 16.3% |
| Immigrants | Europe | 54.8 /100 | #166 | Average 16.3% |
| Yugoslavians | 53.9 /100 | #167 | Average 16.3% |
| Costa Ricans | 53.6 /100 | #168 | Average 16.3% |
| Northern Europeans | 52.8 /100 | #169 | Average 16.3% |
| Scandinavians | 52.3 /100 | #170 | Average 16.3% |
| Immigrants | Morocco | 50.7 /100 | #171 | Average 16.3% |
| Immigrants | Sierra Leone | 50.1 /100 | #172 | Average 16.3% |
| Immigrants | St. Vincent and the Grenadines | 50.0 /100 | #173 | Average 16.3% |