Jamaican vs Immigrants from Czechoslovakia Single Father Poverty
COMPARE
Jamaican
Immigrants from Czechoslovakia
Single Father Poverty
Single Father Poverty Comparison
Jamaicans
Immigrants from Czechoslovakia
17.3%
SINGLE FATHER POVERTY
0.3/ 100
METRIC RATING
266th/ 347
METRIC RANK
16.2%
SINGLE FATHER POVERTY
62.8/ 100
METRIC RATING
157th/ 347
METRIC RANK
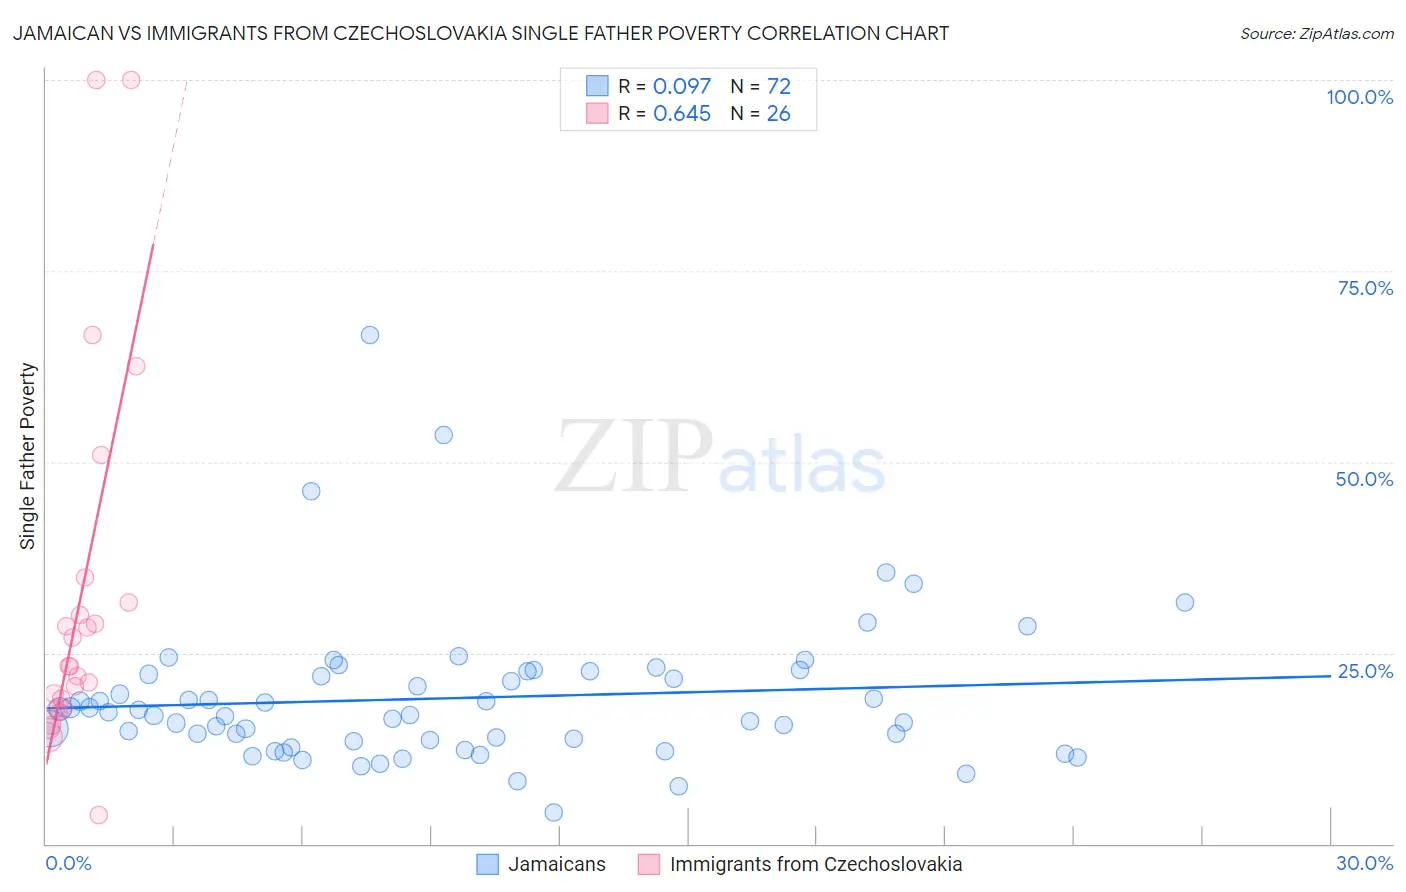
Jamaican vs Immigrants from Czechoslovakia Single Father Poverty Correlation Chart
The statistical analysis conducted on geographies consisting of 295,636,374 people shows a slight positive correlation between the proportion of Jamaicans and poverty level among single fathers in the United States with a correlation coefficient (R) of 0.097 and weighted average of 17.3%. Similarly, the statistical analysis conducted on geographies consisting of 162,409,027 people shows a significant positive correlation between the proportion of Immigrants from Czechoslovakia and poverty level among single fathers in the United States with a correlation coefficient (R) of 0.645 and weighted average of 16.2%, a difference of 7.0%.
Single Father Poverty Correlation Summary
| Measurement | Jamaican | Immigrants from Czechoslovakia |
| Minimum | 4.1% | 3.7% |
| Maximum | 66.7% | 100.0% |
| Range | 62.6% | 96.3% |
| Mean | 19.1% | 32.3% |
| Median | 17.1% | 23.3% |
| Interquartile 25% (IQ1) | 13.5% | 17.7% |
| Interquartile 75% (IQ3) | 22.4% | 31.6% |
| Interquartile Range (IQR) | 8.8% | 14.0% |
| Standard Deviation (Sample) | 9.8% | 24.4% |
| Standard Deviation (Population) | 9.8% | 24.0% |
Similar Demographics by Single Father Poverty
Demographics Similar to Jamaicans by Single Father Poverty
In terms of single father poverty, the demographic groups most similar to Jamaicans are Haitian (17.3%, a difference of 0.040%), Slovene (17.3%, a difference of 0.060%), Polish (17.3%, a difference of 0.060%), Immigrants from Caribbean (17.4%, a difference of 0.14%), and Slavic (17.4%, a difference of 0.21%).
| Demographics | Rating | Rank | Single Father Poverty |
| Immigrants | Jamaica | 0.7 /100 | #259 | Tragic 17.2% |
| Spaniards | 0.6 /100 | #260 | Tragic 17.2% |
| Swiss | 0.5 /100 | #261 | Tragic 17.3% |
| Immigrants | Zaire | 0.4 /100 | #262 | Tragic 17.3% |
| Lithuanians | 0.4 /100 | #263 | Tragic 17.3% |
| Slovenes | 0.3 /100 | #264 | Tragic 17.3% |
| Poles | 0.3 /100 | #265 | Tragic 17.3% |
| Jamaicans | 0.3 /100 | #266 | Tragic 17.3% |
| Haitians | 0.3 /100 | #267 | Tragic 17.3% |
| Immigrants | Caribbean | 0.3 /100 | #268 | Tragic 17.4% |
| Slavs | 0.3 /100 | #269 | Tragic 17.4% |
| Indonesians | 0.2 /100 | #270 | Tragic 17.4% |
| French American Indians | 0.2 /100 | #271 | Tragic 17.4% |
| Barbadians | 0.1 /100 | #272 | Tragic 17.5% |
| Italians | 0.1 /100 | #273 | Tragic 17.5% |
Demographics Similar to Immigrants from Czechoslovakia by Single Father Poverty
In terms of single father poverty, the demographic groups most similar to Immigrants from Czechoslovakia are Portuguese (16.2%, a difference of 0.020%), Belizean (16.2%, a difference of 0.14%), Immigrants from Sudan (16.2%, a difference of 0.14%), Immigrants from Jordan (16.2%, a difference of 0.16%), and Immigrants from Nicaragua (16.2%, a difference of 0.25%).
| Demographics | Rating | Rank | Single Father Poverty |
| Jordanians | 74.2 /100 | #150 | Good 16.1% |
| Immigrants | France | 73.1 /100 | #151 | Good 16.1% |
| Immigrants | Zimbabwe | 72.1 /100 | #152 | Good 16.1% |
| Immigrants | Israel | 72.0 /100 | #153 | Good 16.1% |
| Mexicans | 70.1 /100 | #154 | Good 16.1% |
| Immigrants | Nicaragua | 67.8 /100 | #155 | Good 16.2% |
| Immigrants | Jordan | 66.0 /100 | #156 | Good 16.2% |
| Immigrants | Czechoslovakia | 62.8 /100 | #157 | Good 16.2% |
| Portuguese | 62.3 /100 | #158 | Good 16.2% |
| Belizeans | 59.9 /100 | #159 | Average 16.2% |
| Immigrants | Sudan | 59.8 /100 | #160 | Average 16.2% |
| Estonians | 56.7 /100 | #161 | Average 16.2% |
| Ugandans | 55.9 /100 | #162 | Average 16.3% |
| Immigrants | Costa Rica | 55.7 /100 | #163 | Average 16.3% |
| Guyanese | 55.2 /100 | #164 | Average 16.3% |