Iroquois vs Immigrants from Sierra Leone Associate's Degree
COMPARE
Iroquois
Immigrants from Sierra Leone
Associate's Degree
Associate's Degree Comparison
Iroquois
Immigrants from Sierra Leone
42.8%
ASSOCIATE'S DEGREE
1.7/ 100
METRIC RATING
238th/ 347
METRIC RANK
46.7%
ASSOCIATE'S DEGREE
59.2/ 100
METRIC RATING
167th/ 347
METRIC RANK
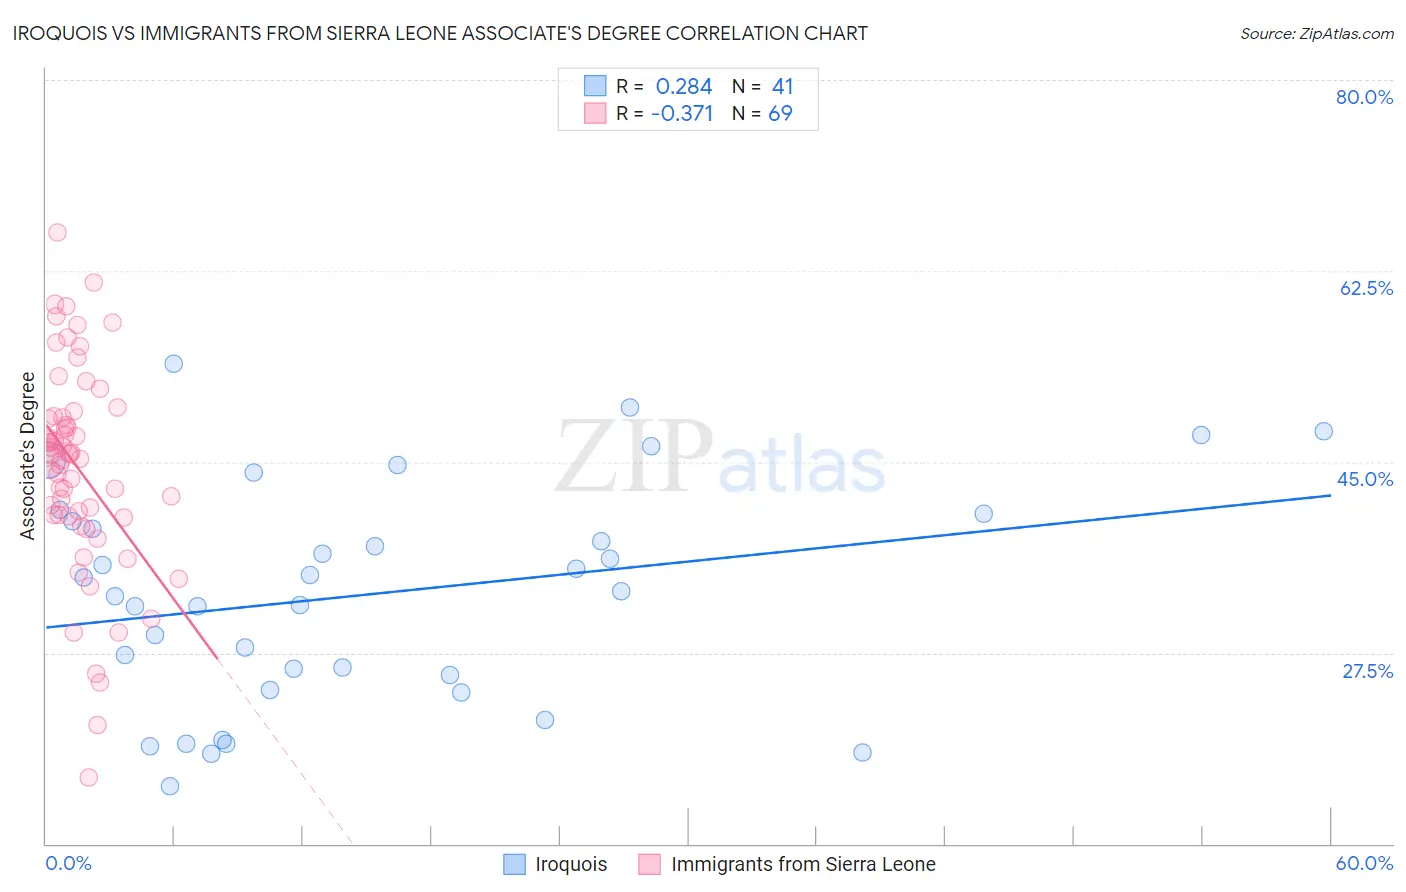
Iroquois vs Immigrants from Sierra Leone Associate's Degree Correlation Chart
The statistical analysis conducted on geographies consisting of 207,308,228 people shows a weak positive correlation between the proportion of Iroquois and percentage of population with at least associate's degree education in the United States with a correlation coefficient (R) of 0.284 and weighted average of 42.8%. Similarly, the statistical analysis conducted on geographies consisting of 101,624,736 people shows a mild negative correlation between the proportion of Immigrants from Sierra Leone and percentage of population with at least associate's degree education in the United States with a correlation coefficient (R) of -0.371 and weighted average of 46.7%, a difference of 9.0%.
Associate's Degree Correlation Summary
| Measurement | Iroquois | Immigrants from Sierra Leone |
| Minimum | 15.2% | 16.1% |
| Maximum | 54.0% | 66.0% |
| Range | 38.7% | 50.0% |
| Mean | 32.9% | 44.5% |
| Median | 33.2% | 45.7% |
| Interquartile 25% (IQ1) | 24.8% | 40.1% |
| Interquartile 75% (IQ3) | 39.9% | 49.2% |
| Interquartile Range (IQR) | 15.1% | 9.1% |
| Standard Deviation (Sample) | 10.1% | 9.5% |
| Standard Deviation (Population) | 9.9% | 9.4% |
Similar Demographics by Associate's Degree
Demographics Similar to Iroquois by Associate's Degree
In terms of associate's degree, the demographic groups most similar to Iroquois are Nonimmigrants (42.9%, a difference of 0.26%), Immigrants from St. Vincent and the Grenadines (42.9%, a difference of 0.28%), Ecuadorian (43.0%, a difference of 0.36%), Tlingit-Haida (43.0%, a difference of 0.45%), and Immigrants from Grenada (42.6%, a difference of 0.51%).
| Demographics | Rating | Rank | Associate's Degree |
| Liberians | 2.9 /100 | #231 | Tragic 43.3% |
| Native Hawaiians | 2.3 /100 | #232 | Tragic 43.1% |
| Tongans | 2.2 /100 | #233 | Tragic 43.0% |
| Tlingit-Haida | 2.1 /100 | #234 | Tragic 43.0% |
| Ecuadorians | 2.0 /100 | #235 | Tragic 43.0% |
| Immigrants | St. Vincent and the Grenadines | 1.9 /100 | #236 | Tragic 42.9% |
| Immigrants | Nonimmigrants | 1.9 /100 | #237 | Tragic 42.9% |
| Iroquois | 1.7 /100 | #238 | Tragic 42.8% |
| Immigrants | Grenada | 1.3 /100 | #239 | Tragic 42.6% |
| Cree | 1.2 /100 | #240 | Tragic 42.5% |
| British West Indians | 1.0 /100 | #241 | Tragic 42.4% |
| Immigrants | West Indies | 1.0 /100 | #242 | Tragic 42.4% |
| Guyanese | 1.0 /100 | #243 | Tragic 42.3% |
| Immigrants | Liberia | 0.9 /100 | #244 | Tragic 42.3% |
| Immigrants | Cambodia | 0.9 /100 | #245 | Tragic 42.3% |
Demographics Similar to Immigrants from Sierra Leone by Associate's Degree
In terms of associate's degree, the demographic groups most similar to Immigrants from Sierra Leone are Hungarian (46.7%, a difference of 0.010%), Immigrants from South America (46.7%, a difference of 0.050%), Colombian (46.8%, a difference of 0.25%), Somali (46.8%, a difference of 0.26%), and Immigrants from Somalia (46.5%, a difference of 0.29%).
| Demographics | Rating | Rank | Associate's Degree |
| Scottish | 65.4 /100 | #160 | Good 46.9% |
| Scandinavians | 65.2 /100 | #161 | Good 46.9% |
| Immigrants | Africa | 63.2 /100 | #162 | Good 46.8% |
| Somalis | 62.5 /100 | #163 | Good 46.8% |
| Colombians | 62.4 /100 | #164 | Good 46.8% |
| Immigrants | South America | 59.9 /100 | #165 | Average 46.7% |
| Hungarians | 59.3 /100 | #166 | Average 46.7% |
| Immigrants | Sierra Leone | 59.2 /100 | #167 | Average 46.7% |
| Immigrants | Somalia | 55.5 /100 | #168 | Average 46.5% |
| Uruguayans | 55.4 /100 | #169 | Average 46.5% |
| Irish | 53.6 /100 | #170 | Average 46.5% |
| Basques | 52.8 /100 | #171 | Average 46.5% |
| Peruvians | 50.5 /100 | #172 | Average 46.4% |
| Immigrants | Iraq | 50.3 /100 | #173 | Average 46.4% |
| English | 50.0 /100 | #174 | Average 46.4% |