Iroquois vs Belgian Single Female Poverty
COMPARE
Iroquois
Belgian
Single Female Poverty
Single Female Poverty Comparison
Iroquois
Belgians
25.7%
SINGLE FEMALE POVERTY
0.0/ 100
METRIC RATING
315th/ 347
METRIC RANK
21.5%
SINGLE FEMALE POVERTY
16.1/ 100
METRIC RATING
206th/ 347
METRIC RANK
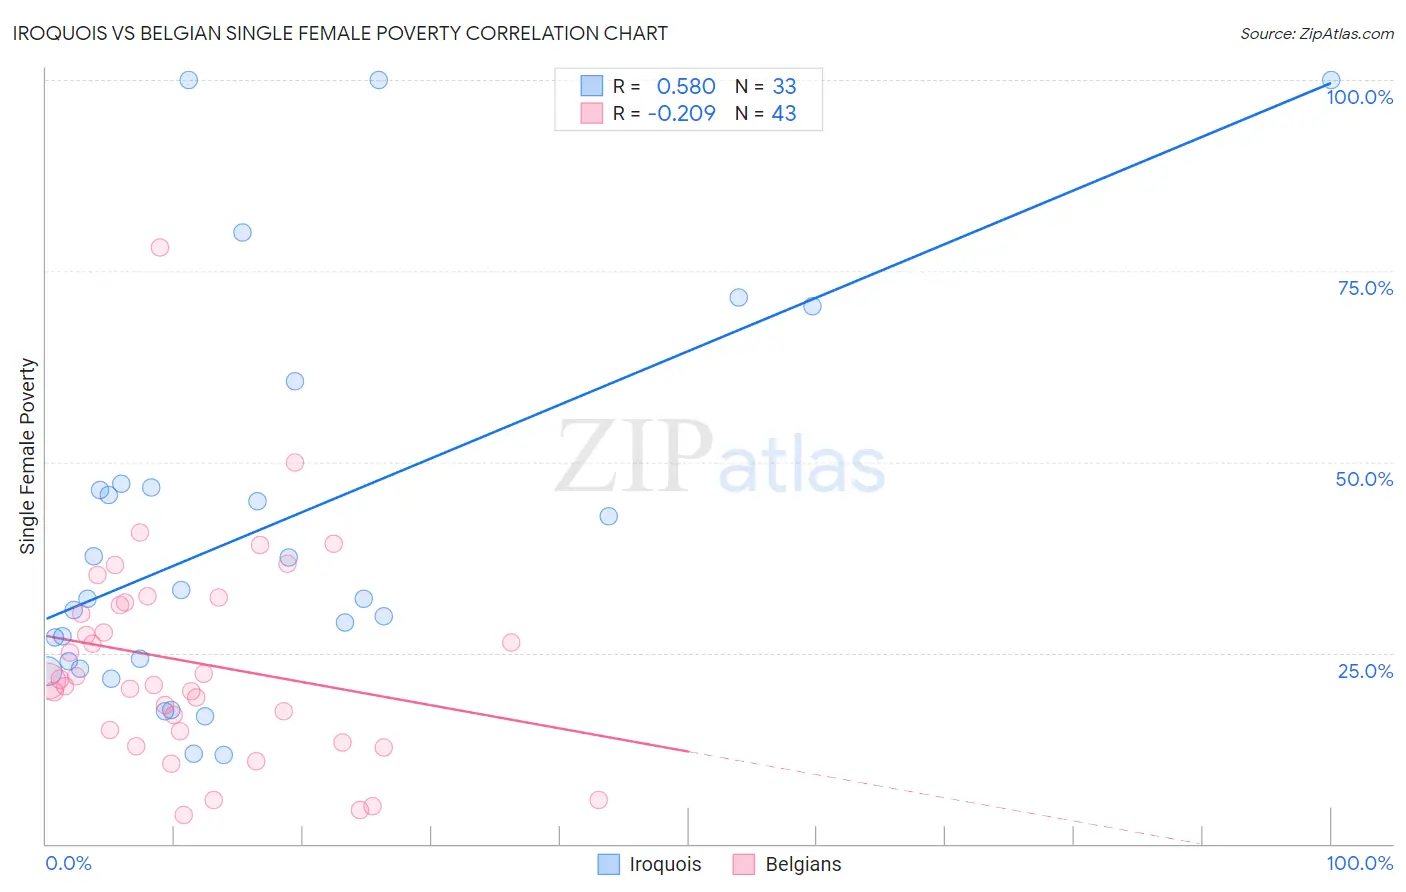
Iroquois vs Belgian Single Female Poverty Correlation Chart
The statistical analysis conducted on geographies consisting of 205,850,666 people shows a substantial positive correlation between the proportion of Iroquois and poverty level among single females in the United States with a correlation coefficient (R) of 0.580 and weighted average of 25.7%. Similarly, the statistical analysis conducted on geographies consisting of 349,903,575 people shows a weak negative correlation between the proportion of Belgians and poverty level among single females in the United States with a correlation coefficient (R) of -0.209 and weighted average of 21.5%, a difference of 19.5%.
Single Female Poverty Correlation Summary
| Measurement | Iroquois | Belgian |
| Minimum | 11.7% | 3.8% |
| Maximum | 100.0% | 78.0% |
| Range | 88.3% | 74.2% |
| Mean | 41.3% | 23.7% |
| Median | 32.1% | 21.2% |
| Interquartile 25% (IQ1) | 23.3% | 14.8% |
| Interquartile 75% (IQ3) | 46.9% | 31.6% |
| Interquartile Range (IQR) | 23.6% | 16.8% |
| Standard Deviation (Sample) | 25.2% | 13.9% |
| Standard Deviation (Population) | 24.8% | 13.7% |
Similar Demographics by Single Female Poverty
Demographics Similar to Iroquois by Single Female Poverty
In terms of single female poverty, the demographic groups most similar to Iroquois are Immigrants from Somalia (25.8%, a difference of 0.15%), Cherokee (25.7%, a difference of 0.32%), Comanche (25.6%, a difference of 0.68%), Paiute (25.5%, a difference of 0.79%), and Immigrants from Honduras (25.5%, a difference of 0.84%).
| Demographics | Rating | Rank | Single Female Poverty |
| Aleuts | 0.0 /100 | #308 | Tragic 25.4% |
| Dominicans | 0.0 /100 | #309 | Tragic 25.4% |
| Central American Indians | 0.0 /100 | #310 | Tragic 25.5% |
| Immigrants | Honduras | 0.0 /100 | #311 | Tragic 25.5% |
| Paiute | 0.0 /100 | #312 | Tragic 25.5% |
| Comanche | 0.0 /100 | #313 | Tragic 25.6% |
| Cherokee | 0.0 /100 | #314 | Tragic 25.7% |
| Iroquois | 0.0 /100 | #315 | Tragic 25.7% |
| Immigrants | Somalia | 0.0 /100 | #316 | Tragic 25.8% |
| Ottawa | 0.0 /100 | #317 | Tragic 26.0% |
| Chickasaw | 0.0 /100 | #318 | Tragic 26.3% |
| Blacks/African Americans | 0.0 /100 | #319 | Tragic 26.4% |
| Arapaho | 0.0 /100 | #320 | Tragic 26.4% |
| Yup'ik | 0.0 /100 | #321 | Tragic 26.6% |
| Seminole | 0.0 /100 | #322 | Tragic 26.8% |
Demographics Similar to Belgians by Single Female Poverty
In terms of single female poverty, the demographic groups most similar to Belgians are Finnish (21.5%, a difference of 0.020%), Ghanaian (21.6%, a difference of 0.040%), Immigrants from Africa (21.5%, a difference of 0.070%), Haitian (21.6%, a difference of 0.070%), and Immigrants from Eastern Africa (21.6%, a difference of 0.11%).
| Demographics | Rating | Rank | Single Female Poverty |
| Immigrants | Immigrants | 22.0 /100 | #199 | Fair 21.4% |
| Irish | 21.4 /100 | #200 | Fair 21.4% |
| Nigerians | 20.9 /100 | #201 | Fair 21.4% |
| Immigrants | Kenya | 20.7 /100 | #202 | Fair 21.4% |
| Immigrants | Haiti | 18.8 /100 | #203 | Poor 21.5% |
| Immigrants | Africa | 16.7 /100 | #204 | Poor 21.5% |
| Finns | 16.2 /100 | #205 | Poor 21.5% |
| Belgians | 16.1 /100 | #206 | Poor 21.5% |
| Ghanaians | 15.7 /100 | #207 | Poor 21.6% |
| Haitians | 15.4 /100 | #208 | Poor 21.6% |
| Immigrants | Eastern Africa | 15.1 /100 | #209 | Poor 21.6% |
| Immigrants | Panama | 14.4 /100 | #210 | Poor 21.6% |
| Icelanders | 14.0 /100 | #211 | Poor 21.6% |
| Jamaicans | 14.0 /100 | #212 | Poor 21.6% |
| Guamanians/Chamorros | 13.7 /100 | #213 | Poor 21.6% |