Iroquois vs Immigrants from Germany Single Male Poverty
COMPARE
Iroquois
Immigrants from Germany
Single Male Poverty
Single Male Poverty Comparison
Iroquois
Immigrants from Germany
14.5%
SINGLE MALE POVERTY
0.0/ 100
METRIC RATING
287th/ 347
METRIC RANK
13.4%
SINGLE MALE POVERTY
2.1/ 100
METRIC RATING
241st/ 347
METRIC RANK
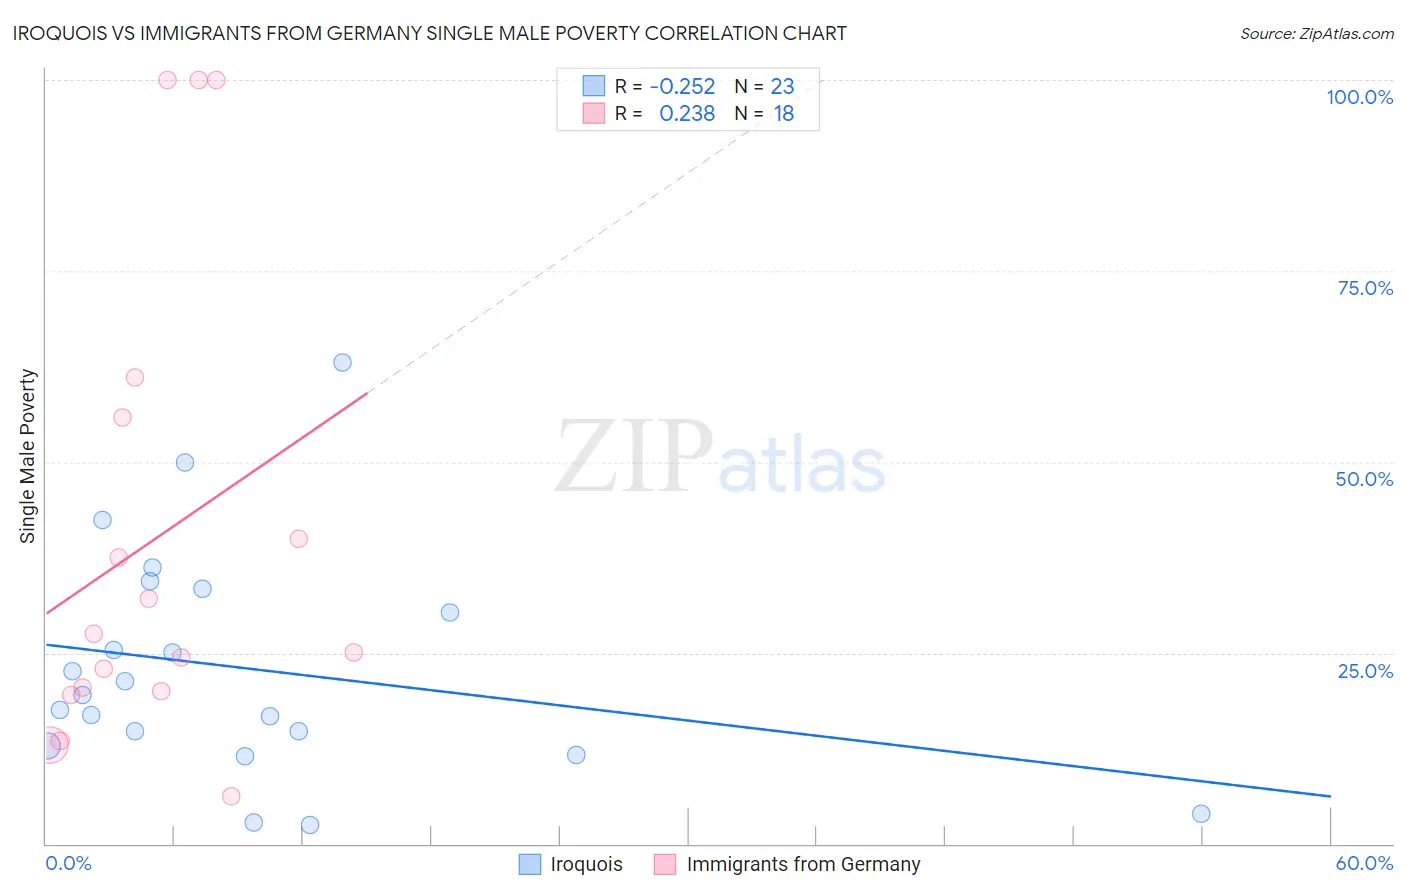
Iroquois vs Immigrants from Germany Single Male Poverty Correlation Chart
The statistical analysis conducted on geographies consisting of 192,366,104 people shows a weak negative correlation between the proportion of Iroquois and poverty level among single males in the United States with a correlation coefficient (R) of -0.252 and weighted average of 14.5%. Similarly, the statistical analysis conducted on geographies consisting of 402,484,283 people shows a weak positive correlation between the proportion of Immigrants from Germany and poverty level among single males in the United States with a correlation coefficient (R) of 0.238 and weighted average of 13.4%, a difference of 7.8%.
Single Male Poverty Correlation Summary
| Measurement | Iroquois | Immigrants from Germany |
| Minimum | 2.4% | 6.2% |
| Maximum | 63.0% | 100.0% |
| Range | 60.6% | 93.8% |
| Mean | 23.0% | 39.9% |
| Median | 19.4% | 26.2% |
| Interquartile 25% (IQ1) | 12.8% | 19.9% |
| Interquartile 75% (IQ3) | 33.3% | 55.8% |
| Interquartile Range (IQR) | 20.5% | 35.9% |
| Standard Deviation (Sample) | 15.1% | 30.9% |
| Standard Deviation (Population) | 14.7% | 30.1% |
Similar Demographics by Single Male Poverty
Demographics Similar to Iroquois by Single Male Poverty
In terms of single male poverty, the demographic groups most similar to Iroquois are White/Caucasian (14.5%, a difference of 0.0%), Immigrants from Dominica (14.5%, a difference of 0.090%), Celtic (14.5%, a difference of 0.13%), U.S. Virgin Islander (14.5%, a difference of 0.32%), and French (14.4%, a difference of 0.45%).
| Demographics | Rating | Rank | Single Male Poverty |
| Hmong | 0.0 /100 | #280 | Tragic 14.2% |
| Hispanics or Latinos | 0.0 /100 | #281 | Tragic 14.2% |
| Spanish Americans | 0.0 /100 | #282 | Tragic 14.2% |
| Yaqui | 0.0 /100 | #283 | Tragic 14.2% |
| Immigrants | Bahamas | 0.0 /100 | #284 | Tragic 14.4% |
| French | 0.0 /100 | #285 | Tragic 14.4% |
| Celtics | 0.0 /100 | #286 | Tragic 14.5% |
| Iroquois | 0.0 /100 | #287 | Tragic 14.5% |
| Whites/Caucasians | 0.0 /100 | #288 | Tragic 14.5% |
| Immigrants | Dominica | 0.0 /100 | #289 | Tragic 14.5% |
| U.S. Virgin Islanders | 0.0 /100 | #290 | Tragic 14.5% |
| Bahamians | 0.0 /100 | #291 | Tragic 14.6% |
| Immigrants | Nonimmigrants | 0.0 /100 | #292 | Tragic 14.6% |
| French Canadians | 0.0 /100 | #293 | Tragic 14.6% |
| Ottawa | 0.0 /100 | #294 | Tragic 14.6% |
Demographics Similar to Immigrants from Germany by Single Male Poverty
In terms of single male poverty, the demographic groups most similar to Immigrants from Germany are Carpatho Rusyn (13.4%, a difference of 0.010%), Barbadian (13.4%, a difference of 0.060%), Belizean (13.4%, a difference of 0.11%), Immigrants from Senegal (13.5%, a difference of 0.33%), and Czechoslovakian (13.4%, a difference of 0.42%).
| Demographics | Rating | Rank | Single Male Poverty |
| Canadians | 4.0 /100 | #234 | Tragic 13.3% |
| Bangladeshis | 3.7 /100 | #235 | Tragic 13.3% |
| Luxembourgers | 3.6 /100 | #236 | Tragic 13.4% |
| British West Indians | 3.4 /100 | #237 | Tragic 13.4% |
| Immigrants | Ghana | 3.2 /100 | #238 | Tragic 13.4% |
| Czechoslovakians | 3.0 /100 | #239 | Tragic 13.4% |
| Belizeans | 2.3 /100 | #240 | Tragic 13.4% |
| Immigrants | Germany | 2.1 /100 | #241 | Tragic 13.4% |
| Carpatho Rusyns | 2.1 /100 | #242 | Tragic 13.4% |
| Barbadians | 2.1 /100 | #243 | Tragic 13.4% |
| Immigrants | Senegal | 1.7 /100 | #244 | Tragic 13.5% |
| Immigrants | Latin America | 1.3 /100 | #245 | Tragic 13.5% |
| Immigrants | Micronesia | 1.2 /100 | #246 | Tragic 13.5% |
| Belgians | 1.2 /100 | #247 | Tragic 13.5% |
| Czechs | 1.2 /100 | #248 | Tragic 13.5% |