Iroquois vs Immigrants from Thailand Single Male Poverty
COMPARE
Iroquois
Immigrants from Thailand
Single Male Poverty
Single Male Poverty Comparison
Iroquois
Immigrants from Thailand
14.5%
SINGLE MALE POVERTY
0.0/ 100
METRIC RATING
287th/ 347
METRIC RANK
13.0%
SINGLE MALE POVERTY
26.6/ 100
METRIC RATING
191st/ 347
METRIC RANK
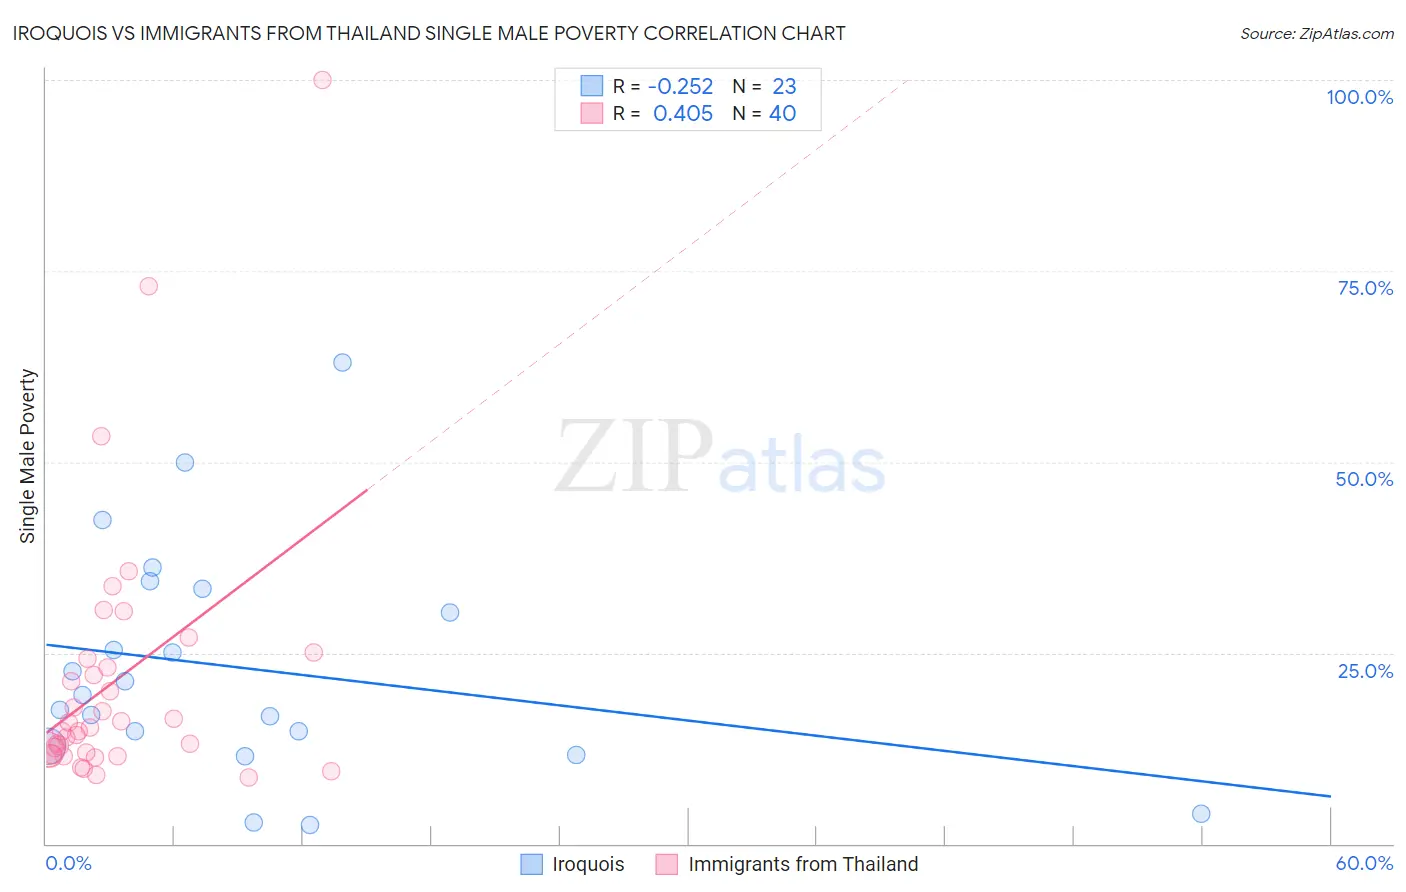
Iroquois vs Immigrants from Thailand Single Male Poverty Correlation Chart
The statistical analysis conducted on geographies consisting of 192,366,104 people shows a weak negative correlation between the proportion of Iroquois and poverty level among single males in the United States with a correlation coefficient (R) of -0.252 and weighted average of 14.5%. Similarly, the statistical analysis conducted on geographies consisting of 289,372,326 people shows a moderate positive correlation between the proportion of Immigrants from Thailand and poverty level among single males in the United States with a correlation coefficient (R) of 0.405 and weighted average of 13.0%, a difference of 11.7%.
Single Male Poverty Correlation Summary
| Measurement | Iroquois | Immigrants from Thailand |
| Minimum | 2.4% | 8.7% |
| Maximum | 63.0% | 100.0% |
| Range | 60.6% | 91.3% |
| Mean | 23.0% | 21.4% |
| Median | 19.4% | 15.0% |
| Interquartile 25% (IQ1) | 12.8% | 11.8% |
| Interquartile 75% (IQ3) | 33.3% | 23.6% |
| Interquartile Range (IQR) | 20.5% | 11.8% |
| Standard Deviation (Sample) | 15.1% | 17.9% |
| Standard Deviation (Population) | 14.7% | 17.7% |
Similar Demographics by Single Male Poverty
Demographics Similar to Iroquois by Single Male Poverty
In terms of single male poverty, the demographic groups most similar to Iroquois are White/Caucasian (14.5%, a difference of 0.0%), Immigrants from Dominica (14.5%, a difference of 0.090%), Celtic (14.5%, a difference of 0.13%), U.S. Virgin Islander (14.5%, a difference of 0.32%), and French (14.4%, a difference of 0.45%).
| Demographics | Rating | Rank | Single Male Poverty |
| Hmong | 0.0 /100 | #280 | Tragic 14.2% |
| Hispanics or Latinos | 0.0 /100 | #281 | Tragic 14.2% |
| Spanish Americans | 0.0 /100 | #282 | Tragic 14.2% |
| Yaqui | 0.0 /100 | #283 | Tragic 14.2% |
| Immigrants | Bahamas | 0.0 /100 | #284 | Tragic 14.4% |
| French | 0.0 /100 | #285 | Tragic 14.4% |
| Celtics | 0.0 /100 | #286 | Tragic 14.5% |
| Iroquois | 0.0 /100 | #287 | Tragic 14.5% |
| Whites/Caucasians | 0.0 /100 | #288 | Tragic 14.5% |
| Immigrants | Dominica | 0.0 /100 | #289 | Tragic 14.5% |
| U.S. Virgin Islanders | 0.0 /100 | #290 | Tragic 14.5% |
| Bahamians | 0.0 /100 | #291 | Tragic 14.6% |
| Immigrants | Nonimmigrants | 0.0 /100 | #292 | Tragic 14.6% |
| French Canadians | 0.0 /100 | #293 | Tragic 14.6% |
| Ottawa | 0.0 /100 | #294 | Tragic 14.6% |
Demographics Similar to Immigrants from Thailand by Single Male Poverty
In terms of single male poverty, the demographic groups most similar to Immigrants from Thailand are Immigrants from Jamaica (13.0%, a difference of 0.010%), Arab (13.0%, a difference of 0.030%), Immigrants from South Africa (13.0%, a difference of 0.030%), Liberian (13.0%, a difference of 0.090%), and Immigrants from England (13.0%, a difference of 0.22%).
| Demographics | Rating | Rank | Single Male Poverty |
| Immigrants | Trinidad and Tobago | 32.5 /100 | #184 | Fair 12.9% |
| Norwegians | 32.0 /100 | #185 | Fair 12.9% |
| Nigerians | 31.9 /100 | #186 | Fair 12.9% |
| Immigrants | Kuwait | 31.9 /100 | #187 | Fair 12.9% |
| Macedonians | 31.5 /100 | #188 | Fair 12.9% |
| Portuguese | 30.2 /100 | #189 | Fair 12.9% |
| Arabs | 27.0 /100 | #190 | Fair 13.0% |
| Immigrants | Thailand | 26.6 /100 | #191 | Fair 13.0% |
| Immigrants | Jamaica | 26.5 /100 | #192 | Fair 13.0% |
| Immigrants | South Africa | 26.1 /100 | #193 | Fair 13.0% |
| Liberians | 25.2 /100 | #194 | Fair 13.0% |
| Immigrants | England | 23.4 /100 | #195 | Fair 13.0% |
| Immigrants | Grenada | 23.1 /100 | #196 | Fair 13.0% |
| Immigrants | Laos | 23.1 /100 | #197 | Fair 13.0% |
| Lithuanians | 22.1 /100 | #198 | Fair 13.0% |