Iroquois vs Apache Single Father Households
COMPARE
Iroquois
Apache
Single Father Households
Single Father Households Comparison
Iroquois
Apache
2.6%
SINGLE FATHER HOUSEHOLDS
0.2/ 100
METRIC RATING
273rd/ 347
METRIC RANK
2.8%
SINGLE FATHER HOUSEHOLDS
0.0/ 100
METRIC RATING
308th/ 347
METRIC RANK
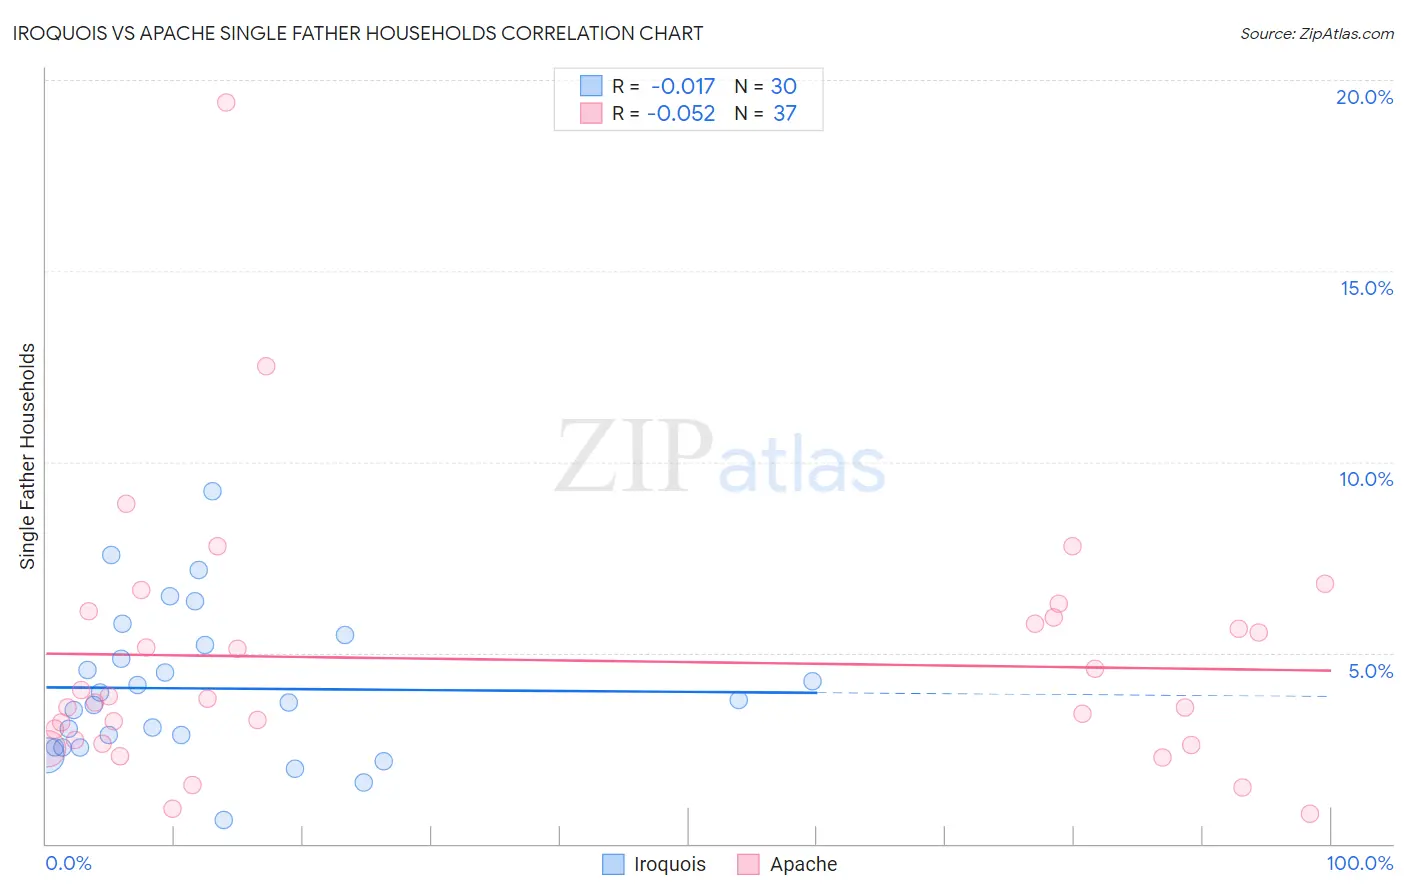
Iroquois vs Apache Single Father Households Correlation Chart
The statistical analysis conducted on geographies consisting of 206,362,821 people shows no correlation between the proportion of Iroquois and percentage of single father households in the United States with a correlation coefficient (R) of -0.017 and weighted average of 2.6%. Similarly, the statistical analysis conducted on geographies consisting of 230,074,281 people shows a slight negative correlation between the proportion of Apache and percentage of single father households in the United States with a correlation coefficient (R) of -0.052 and weighted average of 2.8%, a difference of 8.8%.
Single Father Households Correlation Summary
| Measurement | Iroquois | Apache |
| Minimum | 0.63% | 0.80% |
| Maximum | 9.2% | 19.4% |
| Range | 8.6% | 18.6% |
| Mean | 4.1% | 4.8% |
| Median | 3.7% | 3.8% |
| Interquartile 25% (IQ1) | 2.5% | 2.7% |
| Interquartile 75% (IQ3) | 5.2% | 6.0% |
| Interquartile Range (IQR) | 2.7% | 3.3% |
| Standard Deviation (Sample) | 1.9% | 3.4% |
| Standard Deviation (Population) | 1.9% | 3.4% |
Similar Demographics by Single Father Households
Demographics Similar to Iroquois by Single Father Households
In terms of single father households, the demographic groups most similar to Iroquois are Puerto Rican (2.6%, a difference of 0.030%), Belizean (2.6%, a difference of 0.040%), Creek (2.6%, a difference of 0.050%), Seminole (2.6%, a difference of 0.41%), and Immigrants from Dominican Republic (2.6%, a difference of 0.45%).
| Demographics | Rating | Rank | Single Father Households |
| French American Indians | 0.5 /100 | #266 | Tragic 2.6% |
| Guamanians/Chamorros | 0.4 /100 | #267 | Tragic 2.6% |
| Haitians | 0.4 /100 | #268 | Tragic 2.6% |
| Cubans | 0.3 /100 | #269 | Tragic 2.6% |
| Seminole | 0.3 /100 | #270 | Tragic 2.6% |
| Creek | 0.2 /100 | #271 | Tragic 2.6% |
| Belizeans | 0.2 /100 | #272 | Tragic 2.6% |
| Iroquois | 0.2 /100 | #273 | Tragic 2.6% |
| Puerto Ricans | 0.2 /100 | #274 | Tragic 2.6% |
| Immigrants | Dominican Republic | 0.2 /100 | #275 | Tragic 2.6% |
| Immigrants | Haiti | 0.1 /100 | #276 | Tragic 2.6% |
| Shoshone | 0.1 /100 | #277 | Tragic 2.6% |
| Cherokee | 0.1 /100 | #278 | Tragic 2.6% |
| Samoans | 0.1 /100 | #279 | Tragic 2.6% |
| Immigrants | Portugal | 0.1 /100 | #280 | Tragic 2.6% |
Demographics Similar to Apache by Single Father Households
In terms of single father households, the demographic groups most similar to Apache are Hopi (2.8%, a difference of 0.18%), Immigrants from the Azores (2.8%, a difference of 0.35%), Hispanic or Latino (2.8%, a difference of 0.50%), Mexican American Indian (2.8%, a difference of 0.66%), and Central American (2.9%, a difference of 0.71%).
| Demographics | Rating | Rank | Single Father Households |
| Immigrants | Latin America | 0.0 /100 | #301 | Tragic 2.8% |
| Spanish Americans | 0.0 /100 | #302 | Tragic 2.8% |
| Immigrants | Honduras | 0.0 /100 | #303 | Tragic 2.8% |
| Mexican American Indians | 0.0 /100 | #304 | Tragic 2.8% |
| Hispanics or Latinos | 0.0 /100 | #305 | Tragic 2.8% |
| Immigrants | Azores | 0.0 /100 | #306 | Tragic 2.8% |
| Hopi | 0.0 /100 | #307 | Tragic 2.8% |
| Apache | 0.0 /100 | #308 | Tragic 2.8% |
| Central Americans | 0.0 /100 | #309 | Tragic 2.9% |
| Immigrants | Laos | 0.0 /100 | #310 | Tragic 2.9% |
| Spanish American Indians | 0.0 /100 | #311 | Tragic 2.9% |
| Tsimshian | 0.0 /100 | #312 | Tragic 2.9% |
| Arapaho | 0.0 /100 | #313 | Tragic 2.9% |
| Salvadorans | 0.0 /100 | #314 | Tragic 2.9% |
| Cheyenne | 0.0 /100 | #315 | Tragic 2.9% |