Iranian vs Immigrants from Guyana High School Diploma
COMPARE
Iranian
Immigrants from Guyana
High School Diploma
High School Diploma Comparison
Iranians
Immigrants from Guyana
91.4%
HIGH SCHOOL DIPLOMA
99.9/ 100
METRIC RATING
30th/ 347
METRIC RANK
85.3%
HIGH SCHOOL DIPLOMA
0.0/ 100
METRIC RATING
306th/ 347
METRIC RANK
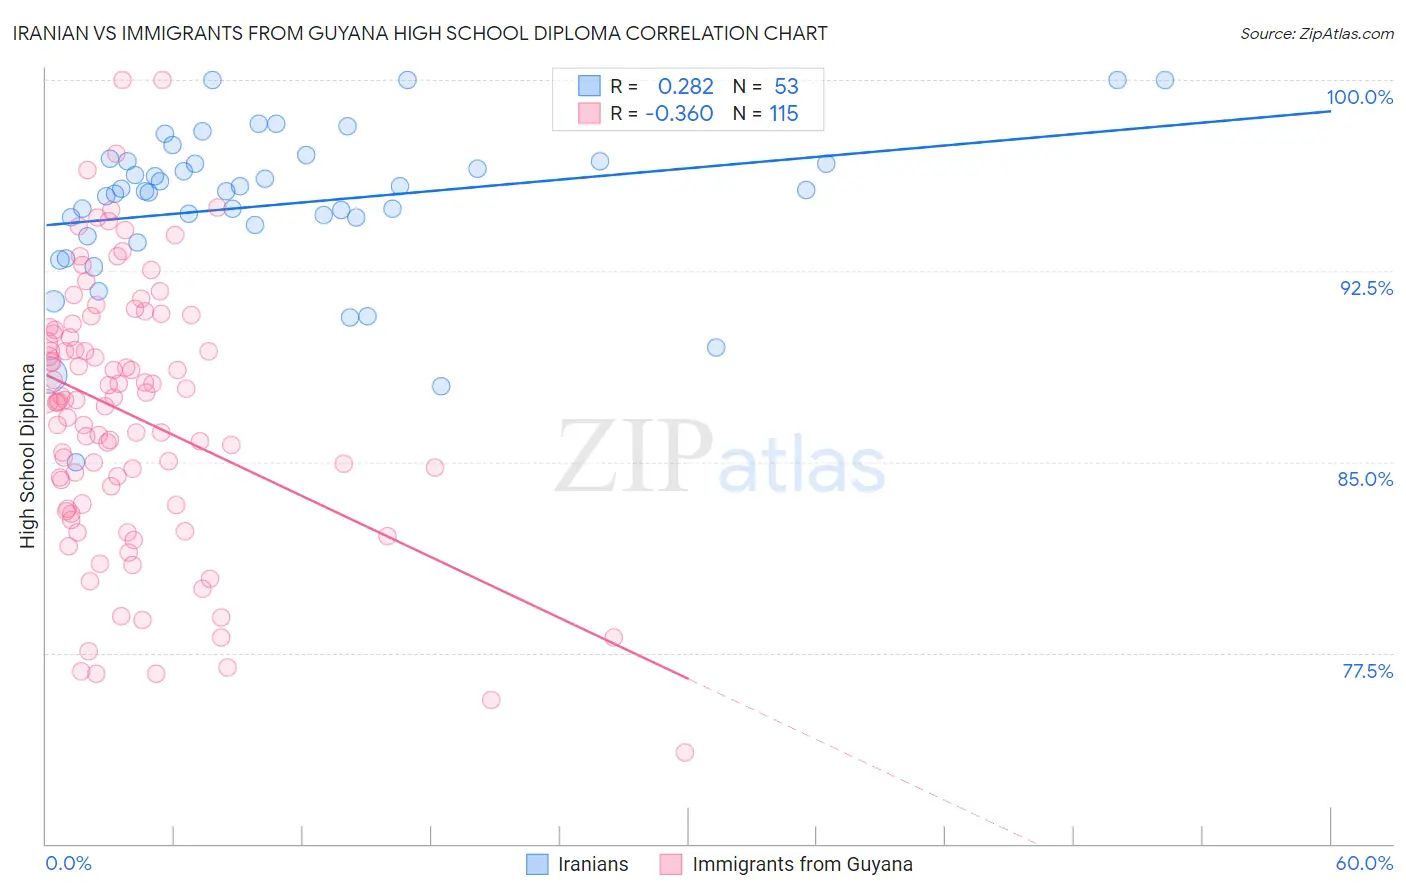
Iranian vs Immigrants from Guyana High School Diploma Correlation Chart
The statistical analysis conducted on geographies consisting of 316,901,778 people shows a weak positive correlation between the proportion of Iranians and percentage of population with at least high school diploma education in the United States with a correlation coefficient (R) of 0.282 and weighted average of 91.4%. Similarly, the statistical analysis conducted on geographies consisting of 183,673,461 people shows a mild negative correlation between the proportion of Immigrants from Guyana and percentage of population with at least high school diploma education in the United States with a correlation coefficient (R) of -0.360 and weighted average of 85.3%, a difference of 7.2%.
High School Diploma Correlation Summary
| Measurement | Iranian | Immigrants from Guyana |
| Minimum | 85.0% | 73.6% |
| Maximum | 100.0% | 100.0% |
| Range | 15.0% | 26.4% |
| Mean | 95.1% | 86.8% |
| Median | 95.6% | 87.4% |
| Interquartile 25% (IQ1) | 94.1% | 83.3% |
| Interquartile 75% (IQ3) | 96.8% | 90.2% |
| Interquartile Range (IQR) | 2.7% | 6.9% |
| Standard Deviation (Sample) | 3.1% | 5.2% |
| Standard Deviation (Population) | 3.0% | 5.2% |
Similar Demographics by High School Diploma
Demographics Similar to Iranians by High School Diploma
In terms of high school diploma, the demographic groups most similar to Iranians are European (91.4%, a difference of 0.010%), Immigrants from Northern Europe (91.4%, a difference of 0.010%), English (91.4%, a difference of 0.010%), Okinawan (91.4%, a difference of 0.010%), and Scottish (91.4%, a difference of 0.020%).
| Demographics | Rating | Rank | High School Diploma |
| Scandinavians | 99.9 /100 | #23 | Exceptional 91.5% |
| Italians | 99.9 /100 | #24 | Exceptional 91.5% |
| Thais | 99.9 /100 | #25 | Exceptional 91.5% |
| Russians | 99.9 /100 | #26 | Exceptional 91.5% |
| Cypriots | 99.9 /100 | #27 | Exceptional 91.5% |
| Tlingit-Haida | 99.9 /100 | #28 | Exceptional 91.4% |
| Europeans | 99.9 /100 | #29 | Exceptional 91.4% |
| Iranians | 99.9 /100 | #30 | Exceptional 91.4% |
| Immigrants | Northern Europe | 99.9 /100 | #31 | Exceptional 91.4% |
| English | 99.9 /100 | #32 | Exceptional 91.4% |
| Okinawans | 99.9 /100 | #33 | Exceptional 91.4% |
| Scottish | 99.9 /100 | #34 | Exceptional 91.4% |
| Irish | 99.9 /100 | #35 | Exceptional 91.4% |
| Tsimshian | 99.9 /100 | #36 | Exceptional 91.3% |
| Immigrants | Ireland | 99.9 /100 | #37 | Exceptional 91.3% |
Demographics Similar to Immigrants from Guyana by High School Diploma
In terms of high school diploma, the demographic groups most similar to Immigrants from Guyana are Nepalese (85.3%, a difference of 0.050%), Immigrants from Portugal (85.3%, a difference of 0.050%), Navajo (85.2%, a difference of 0.090%), Immigrants from Armenia (85.2%, a difference of 0.10%), and Immigrants from Dominica (85.2%, a difference of 0.11%).
| Demographics | Rating | Rank | High School Diploma |
| Guyanese | 0.0 /100 | #299 | Tragic 85.5% |
| Immigrants | Bangladesh | 0.0 /100 | #300 | Tragic 85.5% |
| Vietnamese | 0.0 /100 | #301 | Tragic 85.4% |
| Immigrants | Haiti | 0.0 /100 | #302 | Tragic 85.4% |
| Cubans | 0.0 /100 | #303 | Tragic 85.4% |
| Nepalese | 0.0 /100 | #304 | Tragic 85.3% |
| Immigrants | Portugal | 0.0 /100 | #305 | Tragic 85.3% |
| Immigrants | Guyana | 0.0 /100 | #306 | Tragic 85.3% |
| Navajo | 0.0 /100 | #307 | Tragic 85.2% |
| Immigrants | Armenia | 0.0 /100 | #308 | Tragic 85.2% |
| Immigrants | Dominica | 0.0 /100 | #309 | Tragic 85.2% |
| Apache | 0.0 /100 | #310 | Tragic 85.1% |
| Ecuadorians | 0.0 /100 | #311 | Tragic 85.1% |
| Cape Verdeans | 0.0 /100 | #312 | Tragic 85.1% |
| Immigrants | Ecuador | 0.0 /100 | #313 | Tragic 84.8% |