Immigrants from Middle Africa vs Immigrants from Guyana Married-Couple Family Poverty
COMPARE
Immigrants from Middle Africa
Immigrants from Guyana
Married-Couple Family Poverty
Married-Couple Family Poverty Comparison
Immigrants from Middle Africa
Immigrants from Guyana
5.4%
MARRIED-COUPLE FAMILY POVERTY
23.8/ 100
METRIC RATING
202nd/ 347
METRIC RANK
6.7%
MARRIED-COUPLE FAMILY POVERTY
0.0/ 100
METRIC RATING
298th/ 347
METRIC RANK
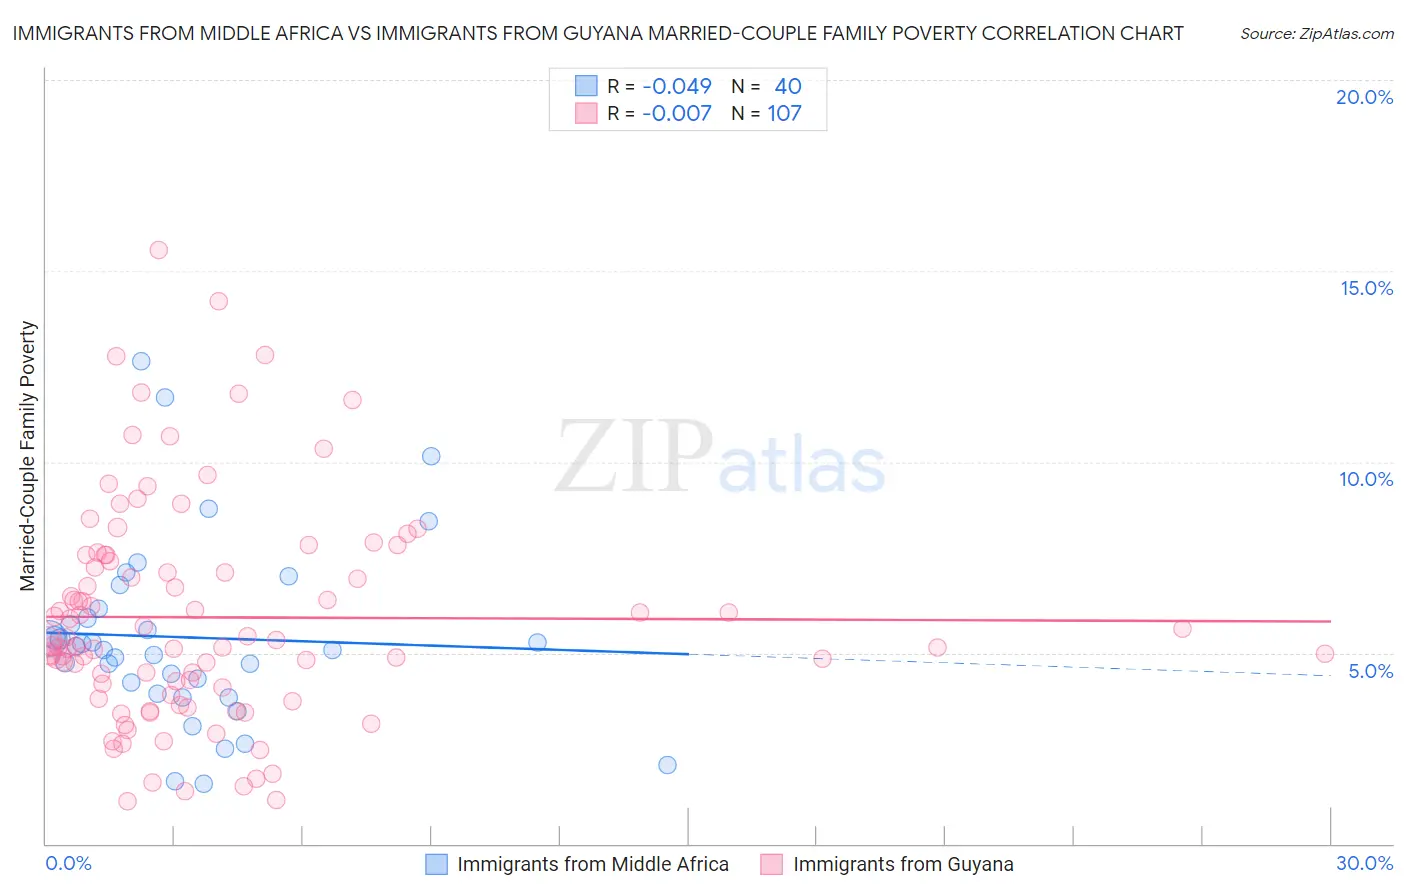
Immigrants from Middle Africa vs Immigrants from Guyana Married-Couple Family Poverty Correlation Chart
The statistical analysis conducted on geographies consisting of 201,849,753 people shows no correlation between the proportion of Immigrants from Middle Africa and poverty level among married-couple families in the United States with a correlation coefficient (R) of -0.049 and weighted average of 5.4%. Similarly, the statistical analysis conducted on geographies consisting of 182,855,108 people shows no correlation between the proportion of Immigrants from Guyana and poverty level among married-couple families in the United States with a correlation coefficient (R) of -0.007 and weighted average of 6.7%, a difference of 23.3%.
Married-Couple Family Poverty Correlation Summary
| Measurement | Immigrants from Middle Africa | Immigrants from Guyana |
| Minimum | 1.6% | 1.1% |
| Maximum | 12.6% | 15.5% |
| Range | 11.1% | 14.4% |
| Mean | 5.4% | 5.9% |
| Median | 5.1% | 5.3% |
| Interquartile 25% (IQ1) | 4.1% | 4.1% |
| Interquartile 75% (IQ3) | 6.0% | 7.6% |
| Interquartile Range (IQR) | 2.0% | 3.5% |
| Standard Deviation (Sample) | 2.4% | 2.9% |
| Standard Deviation (Population) | 2.4% | 2.8% |
Similar Demographics by Married-Couple Family Poverty
Demographics Similar to Immigrants from Middle Africa by Married-Couple Family Poverty
In terms of married-couple family poverty, the demographic groups most similar to Immigrants from Middle Africa are Lebanese (5.4%, a difference of 0.060%), Immigrants from Morocco (5.4%, a difference of 0.080%), Uruguayan (5.4%, a difference of 0.19%), Immigrants from Peru (5.4%, a difference of 0.32%), and Immigrants from Belarus (5.4%, a difference of 0.36%).
| Demographics | Rating | Rank | Married-Couple Family Poverty |
| Immigrants | Azores | 27.5 /100 | #195 | Fair 5.4% |
| Spaniards | 27.4 /100 | #196 | Fair 5.4% |
| Liberians | 26.3 /100 | #197 | Fair 5.4% |
| Immigrants | Belarus | 26.2 /100 | #198 | Fair 5.4% |
| Uruguayans | 25.0 /100 | #199 | Fair 5.4% |
| Immigrants | Morocco | 24.3 /100 | #200 | Fair 5.4% |
| Lebanese | 24.1 /100 | #201 | Fair 5.4% |
| Immigrants | Middle Africa | 23.8 /100 | #202 | Fair 5.4% |
| Immigrants | Peru | 21.8 /100 | #203 | Fair 5.4% |
| Immigrants | Costa Rica | 19.4 /100 | #204 | Poor 5.4% |
| Chippewa | 18.9 /100 | #205 | Poor 5.4% |
| Osage | 18.4 /100 | #206 | Poor 5.4% |
| Immigrants | Africa | 17.6 /100 | #207 | Poor 5.5% |
| French American Indians | 16.1 /100 | #208 | Poor 5.5% |
| Immigrants | Syria | 15.4 /100 | #209 | Poor 5.5% |
Demographics Similar to Immigrants from Guyana by Married-Couple Family Poverty
In terms of married-couple family poverty, the demographic groups most similar to Immigrants from Guyana are U.S. Virgin Islander (6.6%, a difference of 0.070%), Kiowa (6.6%, a difference of 0.070%), Immigrants from Uzbekistan (6.6%, a difference of 0.18%), Bahamian (6.6%, a difference of 0.47%), and Nicaraguan (6.7%, a difference of 0.55%).
| Demographics | Rating | Rank | Married-Couple Family Poverty |
| Belizeans | 0.0 /100 | #291 | Tragic 6.5% |
| Immigrants | Lebanon | 0.0 /100 | #292 | Tragic 6.6% |
| Arapaho | 0.0 /100 | #293 | Tragic 6.6% |
| Bahamians | 0.0 /100 | #294 | Tragic 6.6% |
| Immigrants | Uzbekistan | 0.0 /100 | #295 | Tragic 6.6% |
| U.S. Virgin Islanders | 0.0 /100 | #296 | Tragic 6.6% |
| Kiowa | 0.0 /100 | #297 | Tragic 6.6% |
| Immigrants | Guyana | 0.0 /100 | #298 | Tragic 6.7% |
| Nicaraguans | 0.0 /100 | #299 | Tragic 6.7% |
| Immigrants | Belize | 0.0 /100 | #300 | Tragic 6.7% |
| Central Americans | 0.0 /100 | #301 | Tragic 6.7% |
| Immigrants | Ecuador | 0.0 /100 | #302 | Tragic 6.7% |
| Immigrants | El Salvador | 0.0 /100 | #303 | Tragic 6.8% |
| Cubans | 0.0 /100 | #304 | Tragic 6.8% |
| Haitians | 0.0 /100 | #305 | Tragic 6.8% |