Houma vs Immigrants from Guyana Married-Couple Family Poverty
COMPARE
Houma
Immigrants from Guyana
Married-Couple Family Poverty
Married-Couple Family Poverty Comparison
Houma
Immigrants from Guyana
6.4%
MARRIED-COUPLE FAMILY POVERTY
0.0/ 100
METRIC RATING
279th/ 347
METRIC RANK
6.7%
MARRIED-COUPLE FAMILY POVERTY
0.0/ 100
METRIC RATING
298th/ 347
METRIC RANK
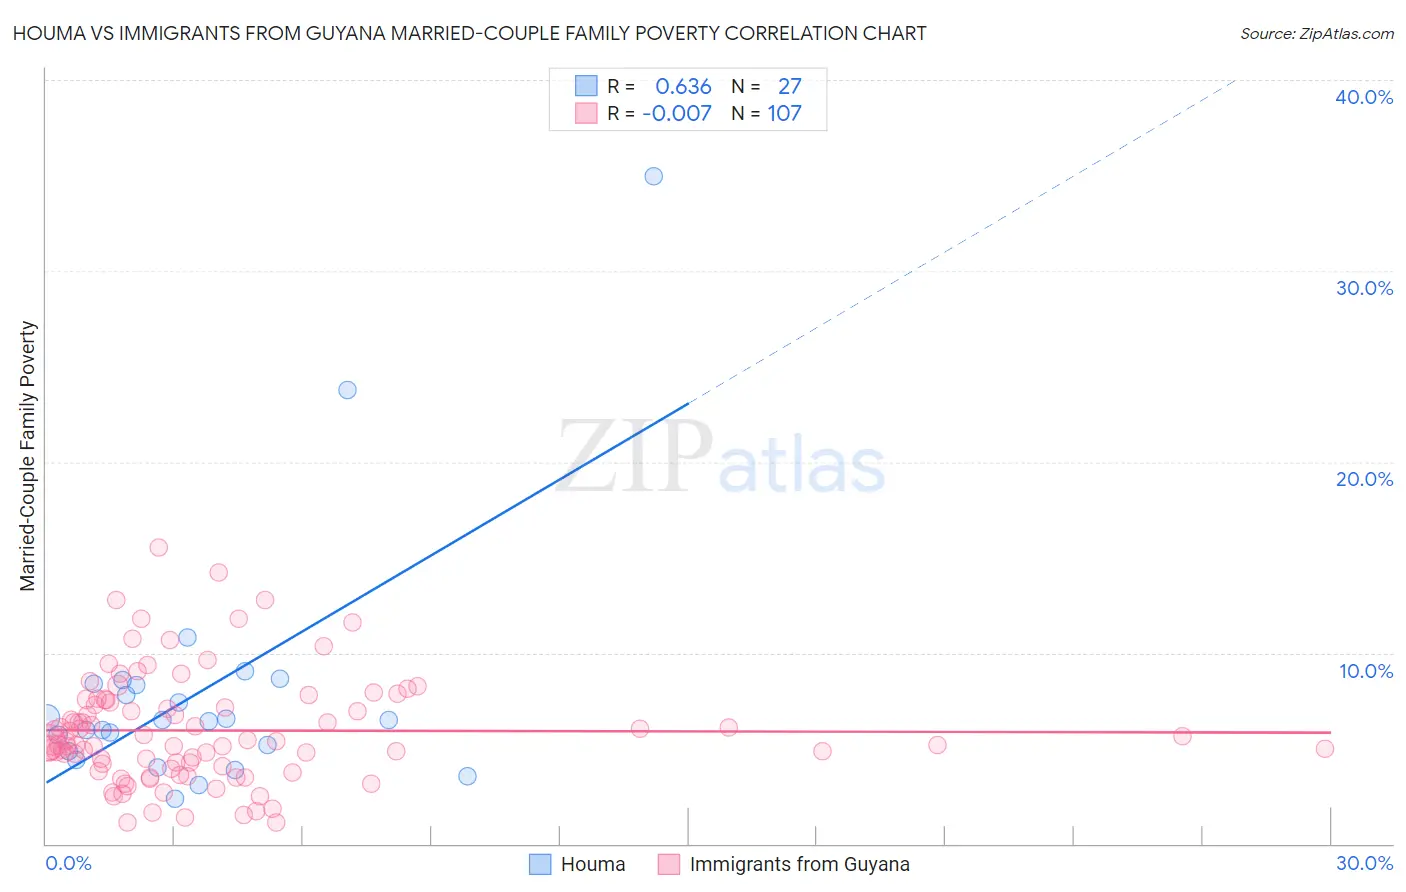
Houma vs Immigrants from Guyana Married-Couple Family Poverty Correlation Chart
The statistical analysis conducted on geographies consisting of 36,736,486 people shows a significant positive correlation between the proportion of Houma and poverty level among married-couple families in the United States with a correlation coefficient (R) of 0.636 and weighted average of 6.4%. Similarly, the statistical analysis conducted on geographies consisting of 182,855,108 people shows no correlation between the proportion of Immigrants from Guyana and poverty level among married-couple families in the United States with a correlation coefficient (R) of -0.007 and weighted average of 6.7%, a difference of 4.3%.
Married-Couple Family Poverty Correlation Summary
| Measurement | Houma | Immigrants from Guyana |
| Minimum | 2.3% | 1.1% |
| Maximum | 34.9% | 15.5% |
| Range | 32.6% | 14.4% |
| Mean | 8.0% | 5.9% |
| Median | 6.5% | 5.3% |
| Interquartile 25% (IQ1) | 4.8% | 4.1% |
| Interquartile 75% (IQ3) | 8.4% | 7.6% |
| Interquartile Range (IQR) | 3.5% | 3.5% |
| Standard Deviation (Sample) | 6.7% | 2.9% |
| Standard Deviation (Population) | 6.5% | 2.8% |
Demographics Similar to Houma and Immigrants from Guyana by Married-Couple Family Poverty
In terms of married-couple family poverty, the demographic groups most similar to Houma are West Indian (6.4%, a difference of 0.050%), Immigrants from Trinidad and Tobago (6.4%, a difference of 0.25%), Mexican American Indian (6.4%, a difference of 0.56%), Seminole (6.4%, a difference of 0.56%), and Ute (6.4%, a difference of 0.95%). Similarly, the demographic groups most similar to Immigrants from Guyana are U.S. Virgin Islander (6.6%, a difference of 0.070%), Kiowa (6.6%, a difference of 0.070%), Immigrants from Uzbekistan (6.6%, a difference of 0.18%), Bahamian (6.6%, a difference of 0.47%), and Arapaho (6.6%, a difference of 1.3%).
| Demographics | Rating | Rank | Married-Couple Family Poverty |
| Immigrants | Trinidad and Tobago | 0.1 /100 | #278 | Tragic 6.4% |
| Houma | 0.0 /100 | #279 | Tragic 6.4% |
| West Indians | 0.0 /100 | #280 | Tragic 6.4% |
| Mexican American Indians | 0.0 /100 | #281 | Tragic 6.4% |
| Seminole | 0.0 /100 | #282 | Tragic 6.4% |
| Ute | 0.0 /100 | #283 | Tragic 6.4% |
| Dutch West Indians | 0.0 /100 | #284 | Tragic 6.4% |
| Blacks/African Americans | 0.0 /100 | #285 | Tragic 6.5% |
| Guyanese | 0.0 /100 | #286 | Tragic 6.5% |
| Ecuadorians | 0.0 /100 | #287 | Tragic 6.5% |
| Salvadorans | 0.0 /100 | #288 | Tragic 6.5% |
| Nepalese | 0.0 /100 | #289 | Tragic 6.5% |
| Immigrants | Barbados | 0.0 /100 | #290 | Tragic 6.5% |
| Belizeans | 0.0 /100 | #291 | Tragic 6.5% |
| Immigrants | Lebanon | 0.0 /100 | #292 | Tragic 6.6% |
| Arapaho | 0.0 /100 | #293 | Tragic 6.6% |
| Bahamians | 0.0 /100 | #294 | Tragic 6.6% |
| Immigrants | Uzbekistan | 0.0 /100 | #295 | Tragic 6.6% |
| U.S. Virgin Islanders | 0.0 /100 | #296 | Tragic 6.6% |
| Kiowa | 0.0 /100 | #297 | Tragic 6.6% |
| Immigrants | Guyana | 0.0 /100 | #298 | Tragic 6.7% |