Immigrants from Liberia vs Black/African American Married-Couple Family Poverty
COMPARE
Immigrants from Liberia
Black/African American
Married-Couple Family Poverty
Married-Couple Family Poverty Comparison
Immigrants from Liberia
Blacks/African Americans
5.5%
MARRIED-COUPLE FAMILY POVERTY
13.3/ 100
METRIC RATING
213th/ 347
METRIC RANK
6.5%
MARRIED-COUPLE FAMILY POVERTY
0.0/ 100
METRIC RATING
285th/ 347
METRIC RANK
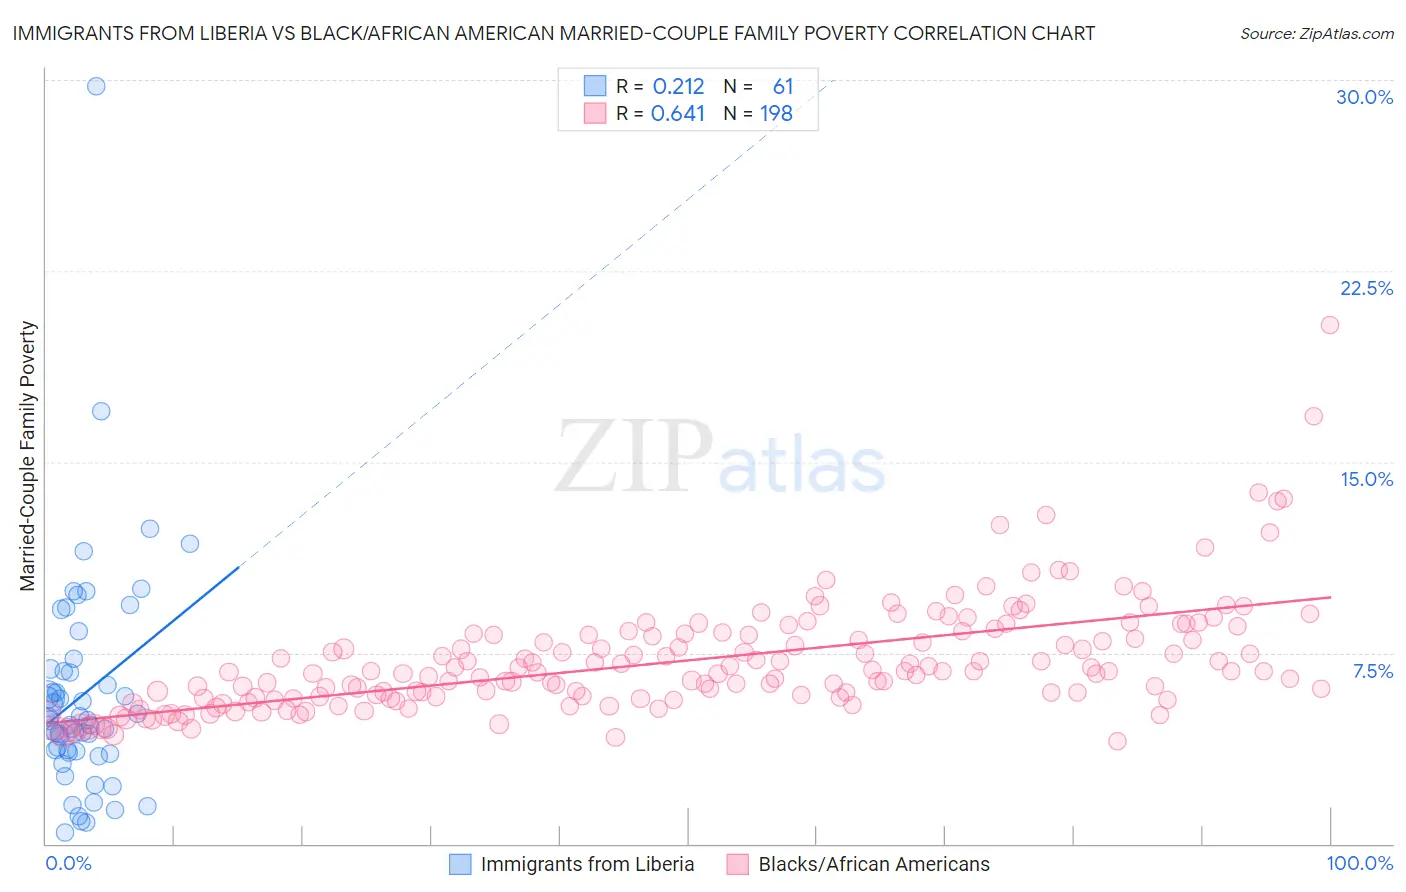
Immigrants from Liberia vs Black/African American Married-Couple Family Poverty Correlation Chart
The statistical analysis conducted on geographies consisting of 134,804,518 people shows a weak positive correlation between the proportion of Immigrants from Liberia and poverty level among married-couple families in the United States with a correlation coefficient (R) of 0.212 and weighted average of 5.5%. Similarly, the statistical analysis conducted on geographies consisting of 553,220,282 people shows a significant positive correlation between the proportion of Blacks/African Americans and poverty level among married-couple families in the United States with a correlation coefficient (R) of 0.641 and weighted average of 6.5%, a difference of 17.7%.
Married-Couple Family Poverty Correlation Summary
| Measurement | Immigrants from Liberia | Black/African American |
| Minimum | 0.42% | 4.0% |
| Maximum | 29.8% | 20.4% |
| Range | 29.4% | 16.3% |
| Mean | 5.8% | 7.2% |
| Median | 4.9% | 6.8% |
| Interquartile 25% (IQ1) | 3.6% | 5.7% |
| Interquartile 75% (IQ3) | 6.8% | 8.2% |
| Interquartile Range (IQR) | 3.2% | 2.5% |
| Standard Deviation (Sample) | 4.5% | 2.2% |
| Standard Deviation (Population) | 4.4% | 2.2% |
Similar Demographics by Married-Couple Family Poverty
Demographics Similar to Immigrants from Liberia by Married-Couple Family Poverty
In terms of married-couple family poverty, the demographic groups most similar to Immigrants from Liberia are Iroquois (5.5%, a difference of 0.040%), Armenian (5.5%, a difference of 0.11%), Immigrants from Thailand (5.5%, a difference of 0.18%), Potawatomi (5.5%, a difference of 0.23%), and Nigerian (5.5%, a difference of 0.25%).
| Demographics | Rating | Rank | Married-Couple Family Poverty |
| Osage | 18.4 /100 | #206 | Poor 5.4% |
| Immigrants | Africa | 17.6 /100 | #207 | Poor 5.5% |
| French American Indians | 16.1 /100 | #208 | Poor 5.5% |
| Immigrants | Syria | 15.4 /100 | #209 | Poor 5.5% |
| Immigrants | Micronesia | 14.4 /100 | #210 | Poor 5.5% |
| Nigerians | 14.3 /100 | #211 | Poor 5.5% |
| Immigrants | Thailand | 14.0 /100 | #212 | Poor 5.5% |
| Immigrants | Liberia | 13.3 /100 | #213 | Poor 5.5% |
| Iroquois | 13.1 /100 | #214 | Poor 5.5% |
| Armenians | 12.8 /100 | #215 | Poor 5.5% |
| Potawatomi | 12.4 /100 | #216 | Poor 5.5% |
| Immigrants | Nigeria | 11.3 /100 | #217 | Poor 5.5% |
| Afghans | 11.2 /100 | #218 | Poor 5.5% |
| Japanese | 9.8 /100 | #219 | Tragic 5.6% |
| Colombians | 9.2 /100 | #220 | Tragic 5.6% |
Demographics Similar to Blacks/African Americans by Married-Couple Family Poverty
In terms of married-couple family poverty, the demographic groups most similar to Blacks/African Americans are Guyanese (6.5%, a difference of 0.10%), Ecuadorian (6.5%, a difference of 0.47%), Dutch West Indian (6.4%, a difference of 0.51%), Ute (6.4%, a difference of 0.63%), and Salvadoran (6.5%, a difference of 0.66%).
| Demographics | Rating | Rank | Married-Couple Family Poverty |
| Immigrants | Trinidad and Tobago | 0.1 /100 | #278 | Tragic 6.4% |
| Houma | 0.0 /100 | #279 | Tragic 6.4% |
| West Indians | 0.0 /100 | #280 | Tragic 6.4% |
| Mexican American Indians | 0.0 /100 | #281 | Tragic 6.4% |
| Seminole | 0.0 /100 | #282 | Tragic 6.4% |
| Ute | 0.0 /100 | #283 | Tragic 6.4% |
| Dutch West Indians | 0.0 /100 | #284 | Tragic 6.4% |
| Blacks/African Americans | 0.0 /100 | #285 | Tragic 6.5% |
| Guyanese | 0.0 /100 | #286 | Tragic 6.5% |
| Ecuadorians | 0.0 /100 | #287 | Tragic 6.5% |
| Salvadorans | 0.0 /100 | #288 | Tragic 6.5% |
| Nepalese | 0.0 /100 | #289 | Tragic 6.5% |
| Immigrants | Barbados | 0.0 /100 | #290 | Tragic 6.5% |
| Belizeans | 0.0 /100 | #291 | Tragic 6.5% |
| Immigrants | Lebanon | 0.0 /100 | #292 | Tragic 6.6% |