Immigrants vs Black/African American Seniors Poverty Over the Age of 75
COMPARE
Immigrants
Black/African American
Seniors Poverty Over the Age of 75
Seniors Poverty Over the Age of 75 Comparison
Immigrants
Blacks/African Americans
13.9%
SENIORS POVERTY OVER THE AGE OF 75
0.1/ 100
METRIC RATING
260th/ 347
METRIC RANK
14.6%
SENIORS POVERTY OVER THE AGE OF 75
0.0/ 100
METRIC RATING
279th/ 347
METRIC RANK
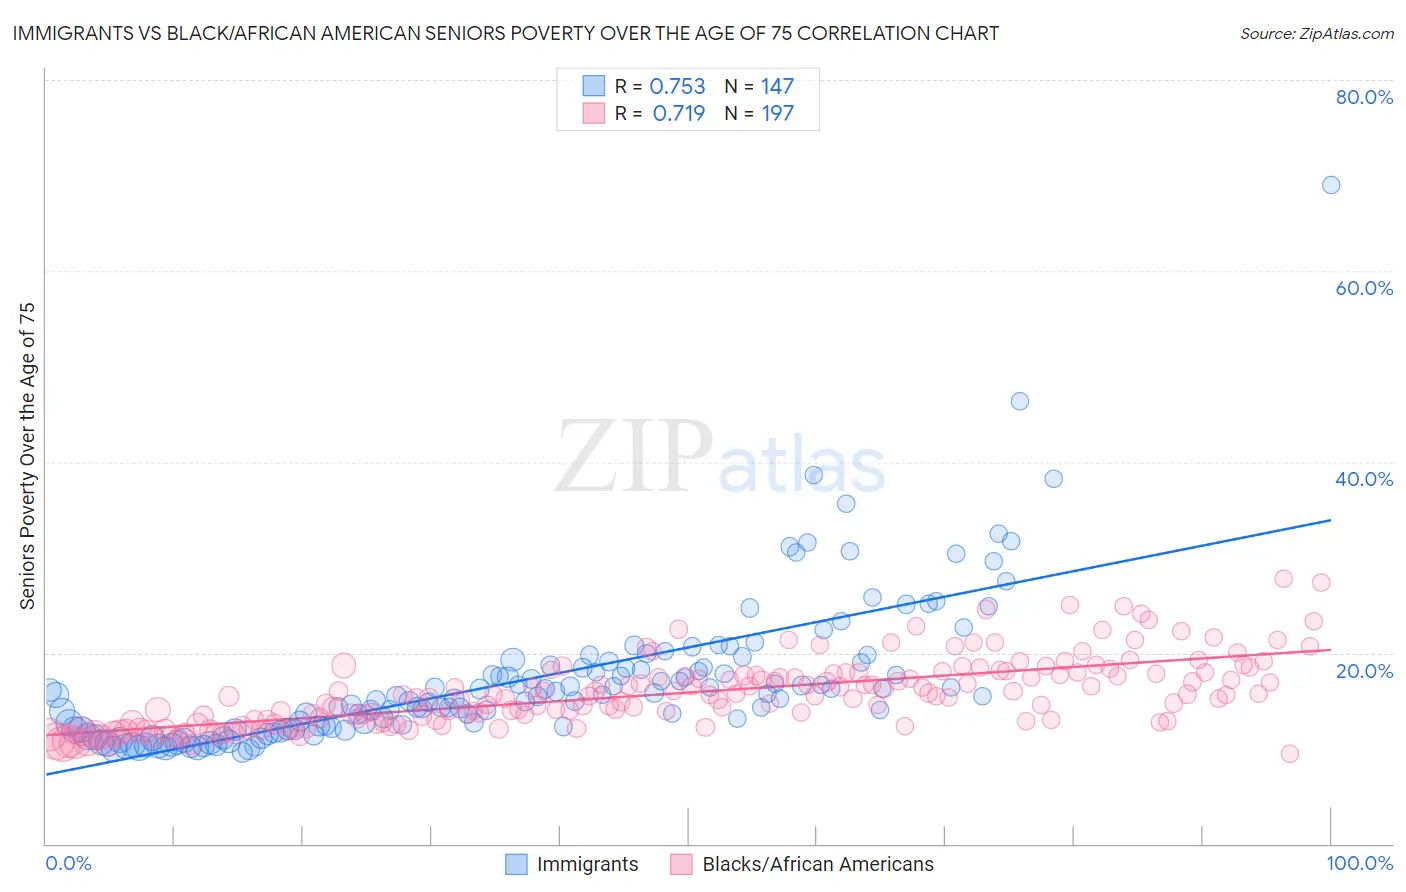
Immigrants vs Black/African American Seniors Poverty Over the Age of 75 Correlation Chart
The statistical analysis conducted on geographies consisting of 559,996,265 people shows a strong positive correlation between the proportion of Immigrants and poverty level among seniors over the age of 75 in the United States with a correlation coefficient (R) of 0.753 and weighted average of 13.9%. Similarly, the statistical analysis conducted on geographies consisting of 551,157,628 people shows a strong positive correlation between the proportion of Blacks/African Americans and poverty level among seniors over the age of 75 in the United States with a correlation coefficient (R) of 0.719 and weighted average of 14.6%, a difference of 5.0%.
Seniors Poverty Over the Age of 75 Correlation Summary
| Measurement | Immigrants | Black/African American |
| Minimum | 9.5% | 9.4% |
| Maximum | 69.0% | 27.7% |
| Range | 59.4% | 18.3% |
| Mean | 17.2% | 15.8% |
| Median | 15.5% | 15.4% |
| Interquartile 25% (IQ1) | 12.0% | 12.9% |
| Interquartile 75% (IQ3) | 18.7% | 17.8% |
| Interquartile Range (IQR) | 6.7% | 4.9% |
| Standard Deviation (Sample) | 7.8% | 3.5% |
| Standard Deviation (Population) | 7.8% | 3.5% |
Demographics Similar to Immigrants and Blacks/African Americans by Seniors Poverty Over the Age of 75
In terms of seniors poverty over the age of 75, the demographic groups most similar to Immigrants are Immigrants from Portugal (13.9%, a difference of 0.070%), Ghanaian (14.0%, a difference of 0.10%), Cajun (14.0%, a difference of 0.33%), Iroquois (14.0%, a difference of 0.46%), and South American (14.1%, a difference of 1.4%). Similarly, the demographic groups most similar to Blacks/African Americans are Immigrants from Colombia (14.6%, a difference of 0.21%), Senegalese (14.5%, a difference of 0.99%), Soviet Union (14.5%, a difference of 1.3%), Immigrants from El Salvador (14.5%, a difference of 1.3%), and Immigrants from Bahamas (14.4%, a difference of 1.5%).
| Demographics | Rating | Rank | Seniors Poverty Over the Age of 75 |
| Immigrants | Portugal | 0.1 /100 | #259 | Tragic 13.9% |
| Immigrants | Immigrants | 0.1 /100 | #260 | Tragic 13.9% |
| Ghanaians | 0.1 /100 | #261 | Tragic 14.0% |
| Cajuns | 0.1 /100 | #262 | Tragic 14.0% |
| Iroquois | 0.1 /100 | #263 | Tragic 14.0% |
| South Americans | 0.0 /100 | #264 | Tragic 14.1% |
| Salvadorans | 0.0 /100 | #265 | Tragic 14.2% |
| Armenians | 0.0 /100 | #266 | Tragic 14.2% |
| Venezuelans | 0.0 /100 | #267 | Tragic 14.2% |
| Colombians | 0.0 /100 | #268 | Tragic 14.3% |
| Immigrants | Venezuela | 0.0 /100 | #269 | Tragic 14.3% |
| Immigrants | Uruguay | 0.0 /100 | #270 | Tragic 14.3% |
| Immigrants | Ghana | 0.0 /100 | #271 | Tragic 14.4% |
| Mexicans | 0.0 /100 | #272 | Tragic 14.4% |
| Immigrants | South America | 0.0 /100 | #273 | Tragic 14.4% |
| Immigrants | Bahamas | 0.0 /100 | #274 | Tragic 14.4% |
| Immigrants | El Salvador | 0.0 /100 | #275 | Tragic 14.5% |
| Soviet Union | 0.0 /100 | #276 | Tragic 14.5% |
| Senegalese | 0.0 /100 | #277 | Tragic 14.5% |
| Immigrants | Colombia | 0.0 /100 | #278 | Tragic 14.6% |
| Blacks/African Americans | 0.0 /100 | #279 | Tragic 14.6% |