Immigrants from Zimbabwe vs Scandinavian Married-Couple Family Poverty
COMPARE
Immigrants from Zimbabwe
Scandinavian
Married-Couple Family Poverty
Married-Couple Family Poverty Comparison
Immigrants from Zimbabwe
Scandinavians
4.3%
MARRIED-COUPLE FAMILY POVERTY
99.7/ 100
METRIC RATING
56th/ 347
METRIC RANK
4.1%
MARRIED-COUPLE FAMILY POVERTY
99.9/ 100
METRIC RATING
28th/ 347
METRIC RANK
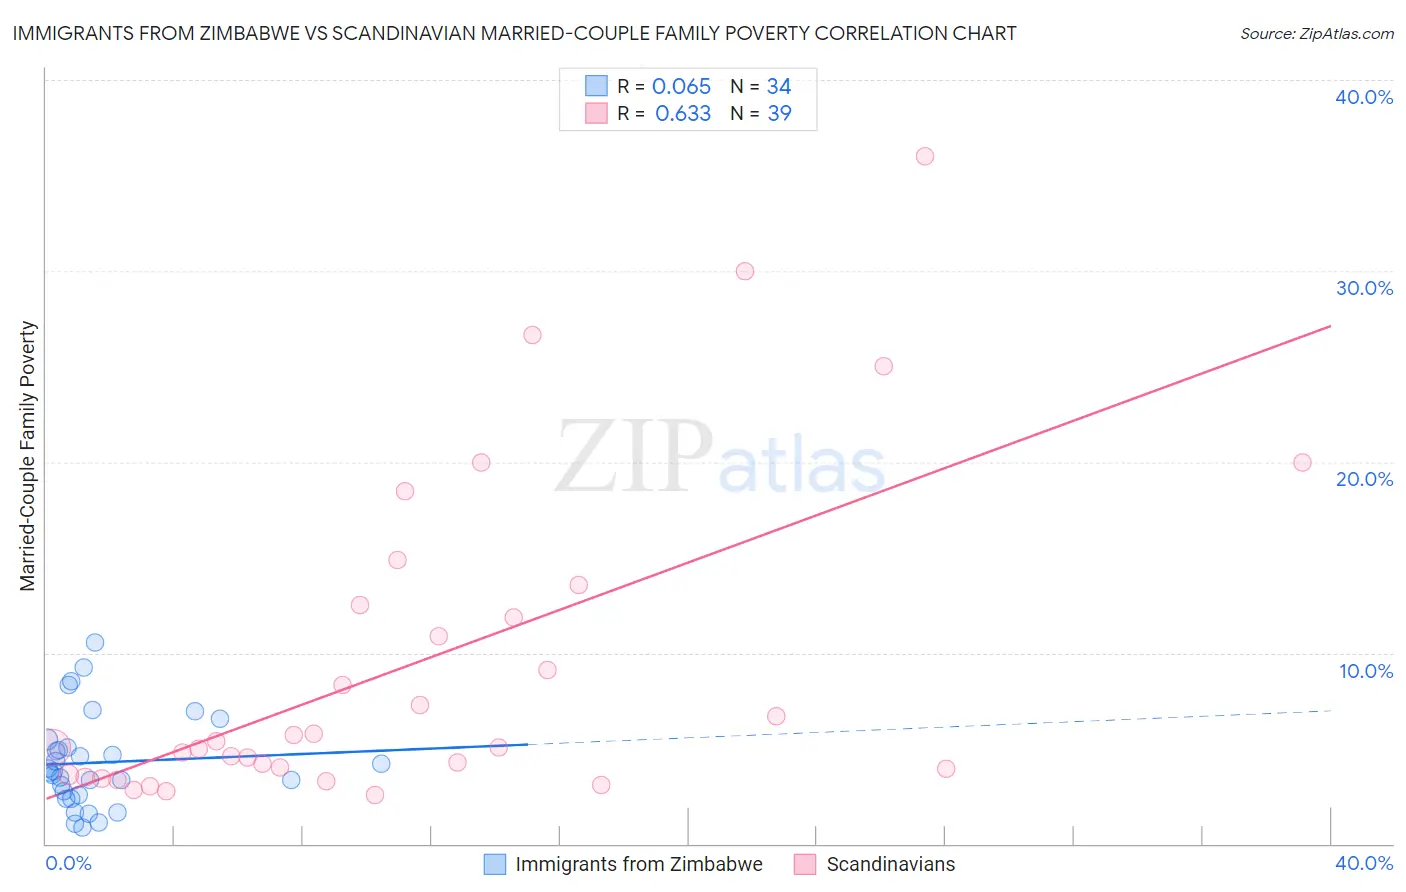
Immigrants from Zimbabwe vs Scandinavian Married-Couple Family Poverty Correlation Chart
The statistical analysis conducted on geographies consisting of 117,574,773 people shows a slight positive correlation between the proportion of Immigrants from Zimbabwe and poverty level among married-couple families in the United States with a correlation coefficient (R) of 0.065 and weighted average of 4.3%. Similarly, the statistical analysis conducted on geographies consisting of 465,332,033 people shows a significant positive correlation between the proportion of Scandinavians and poverty level among married-couple families in the United States with a correlation coefficient (R) of 0.633 and weighted average of 4.1%, a difference of 4.8%.
Married-Couple Family Poverty Correlation Summary
| Measurement | Immigrants from Zimbabwe | Scandinavian |
| Minimum | 0.84% | 2.5% |
| Maximum | 10.5% | 36.0% |
| Range | 9.7% | 33.5% |
| Mean | 4.3% | 9.3% |
| Median | 3.8% | 5.1% |
| Interquartile 25% (IQ1) | 2.6% | 3.6% |
| Interquartile 75% (IQ3) | 5.0% | 12.5% |
| Interquartile Range (IQR) | 2.5% | 8.9% |
| Standard Deviation (Sample) | 2.4% | 8.5% |
| Standard Deviation (Population) | 2.4% | 8.4% |
Similar Demographics by Married-Couple Family Poverty
Demographics Similar to Immigrants from Zimbabwe by Married-Couple Family Poverty
In terms of married-couple family poverty, the demographic groups most similar to Immigrants from Zimbabwe are Immigrants from Netherlands (4.3%, a difference of 0.0%), Czechoslovakian (4.4%, a difference of 0.090%), French (4.3%, a difference of 0.16%), Austrian (4.3%, a difference of 0.18%), and Welsh (4.3%, a difference of 0.44%).
| Demographics | Rating | Rank | Married-Couple Family Poverty |
| Turks | 99.7 /100 | #49 | Exceptional 4.3% |
| Burmese | 99.7 /100 | #50 | Exceptional 4.3% |
| Immigrants | Lithuania | 99.7 /100 | #51 | Exceptional 4.3% |
| Russians | 99.7 /100 | #52 | Exceptional 4.3% |
| Welsh | 99.7 /100 | #53 | Exceptional 4.3% |
| Austrians | 99.7 /100 | #54 | Exceptional 4.3% |
| French | 99.7 /100 | #55 | Exceptional 4.3% |
| Immigrants | Zimbabwe | 99.7 /100 | #56 | Exceptional 4.3% |
| Immigrants | Netherlands | 99.7 /100 | #57 | Exceptional 4.3% |
| Czechoslovakians | 99.7 /100 | #58 | Exceptional 4.4% |
| Immigrants | Sweden | 99.6 /100 | #59 | Exceptional 4.4% |
| Tlingit-Haida | 99.6 /100 | #60 | Exceptional 4.4% |
| Okinawans | 99.6 /100 | #61 | Exceptional 4.4% |
| Immigrants | Australia | 99.6 /100 | #62 | Exceptional 4.4% |
| Immigrants | Sri Lanka | 99.6 /100 | #63 | Exceptional 4.4% |
Demographics Similar to Scandinavians by Married-Couple Family Poverty
In terms of married-couple family poverty, the demographic groups most similar to Scandinavians are Immigrants from Scotland (4.2%, a difference of 0.040%), Danish (4.1%, a difference of 0.11%), Cypriot (4.1%, a difference of 0.22%), Finnish (4.2%, a difference of 0.28%), and Estonian (4.2%, a difference of 0.36%).
| Demographics | Rating | Rank | Married-Couple Family Poverty |
| Zimbabweans | 99.9 /100 | #21 | Exceptional 4.1% |
| Immigrants | Singapore | 99.9 /100 | #22 | Exceptional 4.1% |
| Bhutanese | 99.9 /100 | #23 | Exceptional 4.1% |
| Eastern Europeans | 99.9 /100 | #24 | Exceptional 4.1% |
| Immigrants | Taiwan | 99.9 /100 | #25 | Exceptional 4.1% |
| Cypriots | 99.9 /100 | #26 | Exceptional 4.1% |
| Danes | 99.9 /100 | #27 | Exceptional 4.1% |
| Scandinavians | 99.9 /100 | #28 | Exceptional 4.1% |
| Immigrants | Scotland | 99.9 /100 | #29 | Exceptional 4.2% |
| Finns | 99.9 /100 | #30 | Exceptional 4.2% |
| Estonians | 99.9 /100 | #31 | Exceptional 4.2% |
| Greeks | 99.9 /100 | #32 | Exceptional 4.2% |
| Irish | 99.9 /100 | #33 | Exceptional 4.2% |
| Dutch | 99.9 /100 | #34 | Exceptional 4.2% |
| Europeans | 99.9 /100 | #35 | Exceptional 4.2% |