Immigrants from Zimbabwe vs Lithuanian Married-Couple Family Poverty
COMPARE
Immigrants from Zimbabwe
Lithuanian
Married-Couple Family Poverty
Married-Couple Family Poverty Comparison
Immigrants from Zimbabwe
Lithuanians
4.3%
MARRIED-COUPLE FAMILY POVERTY
99.7/ 100
METRIC RATING
56th/ 347
METRIC RANK
4.0%
MARRIED-COUPLE FAMILY POVERTY
100.0/ 100
METRIC RATING
11th/ 347
METRIC RANK
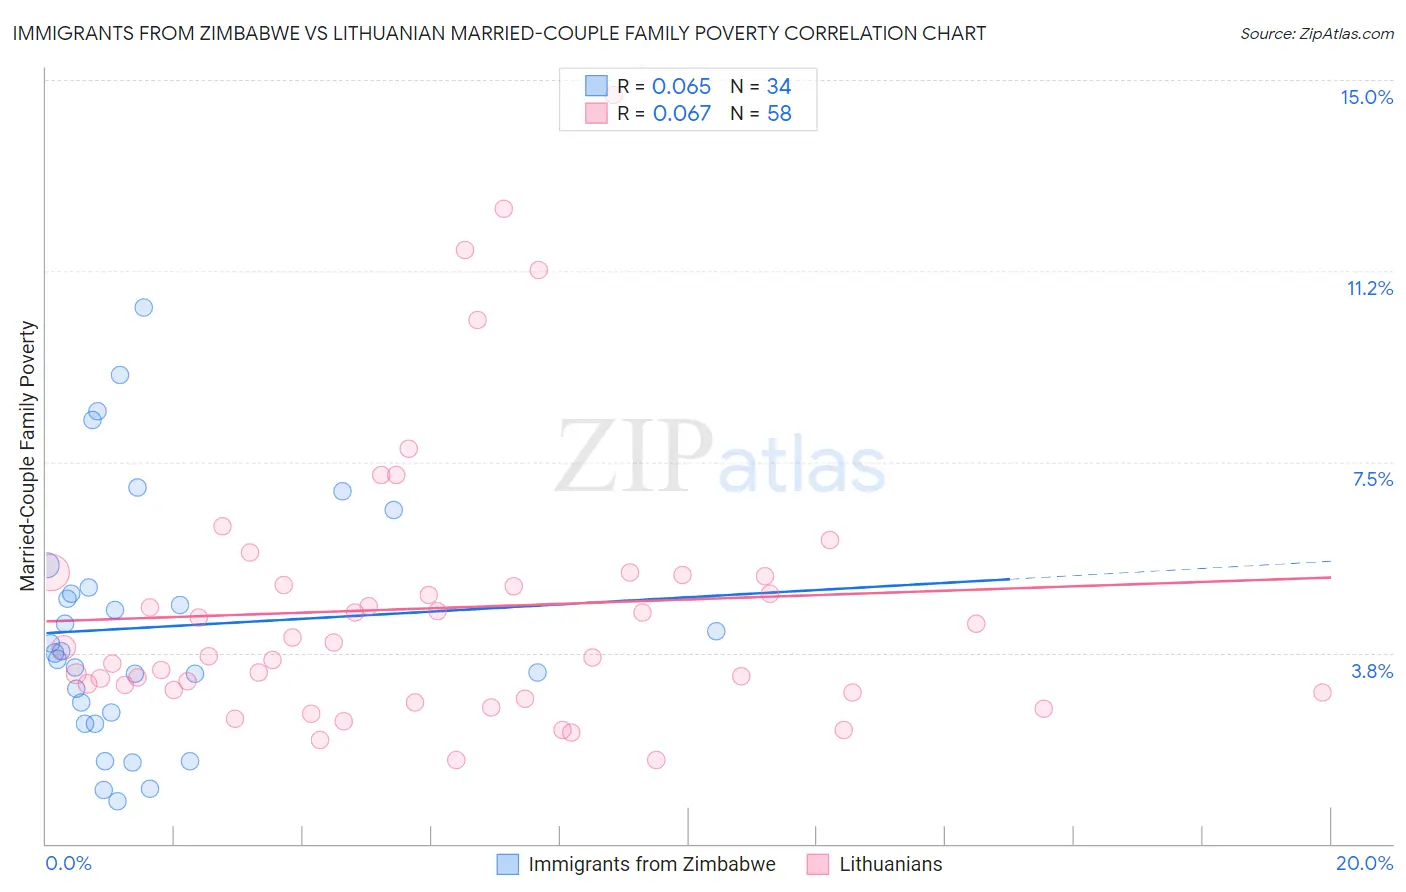
Immigrants from Zimbabwe vs Lithuanian Married-Couple Family Poverty Correlation Chart
The statistical analysis conducted on geographies consisting of 117,574,773 people shows a slight positive correlation between the proportion of Immigrants from Zimbabwe and poverty level among married-couple families in the United States with a correlation coefficient (R) of 0.065 and weighted average of 4.3%. Similarly, the statistical analysis conducted on geographies consisting of 416,141,863 people shows a slight positive correlation between the proportion of Lithuanians and poverty level among married-couple families in the United States with a correlation coefficient (R) of 0.067 and weighted average of 4.0%, a difference of 9.8%.
Married-Couple Family Poverty Correlation Summary
| Measurement | Immigrants from Zimbabwe | Lithuanian |
| Minimum | 0.84% | 1.6% |
| Maximum | 10.5% | 14.7% |
| Range | 9.7% | 13.1% |
| Mean | 4.3% | 4.6% |
| Median | 3.8% | 3.8% |
| Interquartile 25% (IQ1) | 2.6% | 3.0% |
| Interquartile 75% (IQ3) | 5.0% | 5.3% |
| Interquartile Range (IQR) | 2.5% | 2.3% |
| Standard Deviation (Sample) | 2.4% | 2.7% |
| Standard Deviation (Population) | 2.4% | 2.7% |
Similar Demographics by Married-Couple Family Poverty
Demographics Similar to Immigrants from Zimbabwe by Married-Couple Family Poverty
In terms of married-couple family poverty, the demographic groups most similar to Immigrants from Zimbabwe are Immigrants from Netherlands (4.3%, a difference of 0.0%), Czechoslovakian (4.4%, a difference of 0.090%), French (4.3%, a difference of 0.16%), Austrian (4.3%, a difference of 0.18%), and Welsh (4.3%, a difference of 0.44%).
| Demographics | Rating | Rank | Married-Couple Family Poverty |
| Turks | 99.7 /100 | #49 | Exceptional 4.3% |
| Burmese | 99.7 /100 | #50 | Exceptional 4.3% |
| Immigrants | Lithuania | 99.7 /100 | #51 | Exceptional 4.3% |
| Russians | 99.7 /100 | #52 | Exceptional 4.3% |
| Welsh | 99.7 /100 | #53 | Exceptional 4.3% |
| Austrians | 99.7 /100 | #54 | Exceptional 4.3% |
| French | 99.7 /100 | #55 | Exceptional 4.3% |
| Immigrants | Zimbabwe | 99.7 /100 | #56 | Exceptional 4.3% |
| Immigrants | Netherlands | 99.7 /100 | #57 | Exceptional 4.3% |
| Czechoslovakians | 99.7 /100 | #58 | Exceptional 4.4% |
| Immigrants | Sweden | 99.6 /100 | #59 | Exceptional 4.4% |
| Tlingit-Haida | 99.6 /100 | #60 | Exceptional 4.4% |
| Okinawans | 99.6 /100 | #61 | Exceptional 4.4% |
| Immigrants | Australia | 99.6 /100 | #62 | Exceptional 4.4% |
| Immigrants | Sri Lanka | 99.6 /100 | #63 | Exceptional 4.4% |
Demographics Similar to Lithuanians by Married-Couple Family Poverty
In terms of married-couple family poverty, the demographic groups most similar to Lithuanians are Carpatho Rusyn (3.9%, a difference of 0.51%), Croatian (3.9%, a difference of 0.56%), Bulgarian (4.0%, a difference of 0.70%), Thai (3.9%, a difference of 1.0%), and Latvian (3.9%, a difference of 1.5%).
| Demographics | Rating | Rank | Married-Couple Family Poverty |
| Slovenes | 100.0 /100 | #4 | Exceptional 3.8% |
| Swedes | 100.0 /100 | #5 | Exceptional 3.9% |
| Luxembourgers | 100.0 /100 | #6 | Exceptional 3.9% |
| Latvians | 100.0 /100 | #7 | Exceptional 3.9% |
| Thais | 100.0 /100 | #8 | Exceptional 3.9% |
| Croatians | 100.0 /100 | #9 | Exceptional 3.9% |
| Carpatho Rusyns | 100.0 /100 | #10 | Exceptional 3.9% |
| Lithuanians | 100.0 /100 | #11 | Exceptional 4.0% |
| Bulgarians | 100.0 /100 | #12 | Exceptional 4.0% |
| Czechs | 100.0 /100 | #13 | Exceptional 4.0% |
| Slovaks | 100.0 /100 | #14 | Exceptional 4.0% |
| Poles | 100.0 /100 | #15 | Exceptional 4.0% |
| Germans | 100.0 /100 | #16 | Exceptional 4.0% |
| Filipinos | 100.0 /100 | #17 | Exceptional 4.0% |
| Italians | 100.0 /100 | #18 | Exceptional 4.0% |