Immigrants from Zimbabwe vs Immigrants from Grenada Married-Couple Family Poverty
COMPARE
Immigrants from Zimbabwe
Immigrants from Grenada
Married-Couple Family Poverty
Married-Couple Family Poverty Comparison
Immigrants from Zimbabwe
Immigrants from Grenada
4.3%
MARRIED-COUPLE FAMILY POVERTY
99.7/ 100
METRIC RATING
56th/ 347
METRIC RANK
7.3%
MARRIED-COUPLE FAMILY POVERTY
0.0/ 100
METRIC RATING
320th/ 347
METRIC RANK
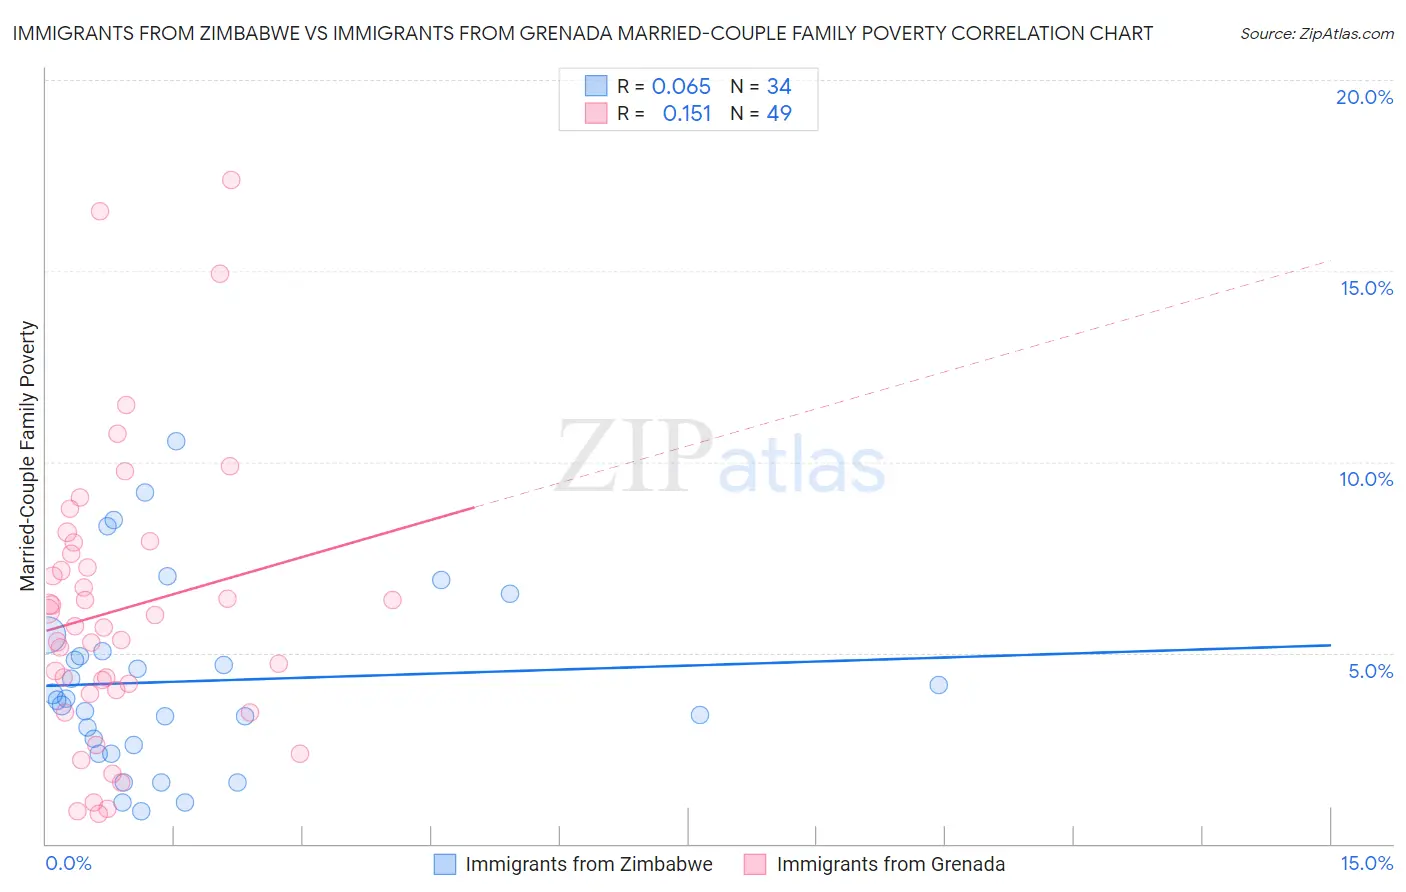
Immigrants from Zimbabwe vs Immigrants from Grenada Married-Couple Family Poverty Correlation Chart
The statistical analysis conducted on geographies consisting of 117,574,773 people shows a slight positive correlation between the proportion of Immigrants from Zimbabwe and poverty level among married-couple families in the United States with a correlation coefficient (R) of 0.065 and weighted average of 4.3%. Similarly, the statistical analysis conducted on geographies consisting of 67,074,791 people shows a poor positive correlation between the proportion of Immigrants from Grenada and poverty level among married-couple families in the United States with a correlation coefficient (R) of 0.151 and weighted average of 7.3%, a difference of 67.7%.
Married-Couple Family Poverty Correlation Summary
| Measurement | Immigrants from Zimbabwe | Immigrants from Grenada |
| Minimum | 0.84% | 0.79% |
| Maximum | 10.5% | 17.4% |
| Range | 9.7% | 16.6% |
| Mean | 4.3% | 6.1% |
| Median | 3.8% | 5.7% |
| Interquartile 25% (IQ1) | 2.6% | 4.0% |
| Interquartile 75% (IQ3) | 5.0% | 7.7% |
| Interquartile Range (IQR) | 2.5% | 3.8% |
| Standard Deviation (Sample) | 2.4% | 3.7% |
| Standard Deviation (Population) | 2.4% | 3.7% |
Similar Demographics by Married-Couple Family Poverty
Demographics Similar to Immigrants from Zimbabwe by Married-Couple Family Poverty
In terms of married-couple family poverty, the demographic groups most similar to Immigrants from Zimbabwe are Immigrants from Netherlands (4.3%, a difference of 0.0%), Czechoslovakian (4.4%, a difference of 0.090%), French (4.3%, a difference of 0.16%), Austrian (4.3%, a difference of 0.18%), and Welsh (4.3%, a difference of 0.44%).
| Demographics | Rating | Rank | Married-Couple Family Poverty |
| Turks | 99.7 /100 | #49 | Exceptional 4.3% |
| Burmese | 99.7 /100 | #50 | Exceptional 4.3% |
| Immigrants | Lithuania | 99.7 /100 | #51 | Exceptional 4.3% |
| Russians | 99.7 /100 | #52 | Exceptional 4.3% |
| Welsh | 99.7 /100 | #53 | Exceptional 4.3% |
| Austrians | 99.7 /100 | #54 | Exceptional 4.3% |
| French | 99.7 /100 | #55 | Exceptional 4.3% |
| Immigrants | Zimbabwe | 99.7 /100 | #56 | Exceptional 4.3% |
| Immigrants | Netherlands | 99.7 /100 | #57 | Exceptional 4.3% |
| Czechoslovakians | 99.7 /100 | #58 | Exceptional 4.4% |
| Immigrants | Sweden | 99.6 /100 | #59 | Exceptional 4.4% |
| Tlingit-Haida | 99.6 /100 | #60 | Exceptional 4.4% |
| Okinawans | 99.6 /100 | #61 | Exceptional 4.4% |
| Immigrants | Australia | 99.6 /100 | #62 | Exceptional 4.4% |
| Immigrants | Sri Lanka | 99.6 /100 | #63 | Exceptional 4.4% |
Demographics Similar to Immigrants from Grenada by Married-Couple Family Poverty
In terms of married-couple family poverty, the demographic groups most similar to Immigrants from Grenada are Immigrants from Caribbean (7.3%, a difference of 0.77%), Immigrants from Honduras (7.3%, a difference of 0.79%), Immigrants from Latin America (7.2%, a difference of 1.2%), Immigrants from Guatemala (7.2%, a difference of 1.4%), and Mexican (7.2%, a difference of 1.5%).
| Demographics | Rating | Rank | Married-Couple Family Poverty |
| Immigrants | St. Vincent and the Grenadines | 0.0 /100 | #313 | Tragic 7.1% |
| British West Indians | 0.0 /100 | #314 | Tragic 7.1% |
| Inupiat | 0.0 /100 | #315 | Tragic 7.1% |
| Hondurans | 0.0 /100 | #316 | Tragic 7.2% |
| Mexicans | 0.0 /100 | #317 | Tragic 7.2% |
| Immigrants | Guatemala | 0.0 /100 | #318 | Tragic 7.2% |
| Immigrants | Latin America | 0.0 /100 | #319 | Tragic 7.2% |
| Immigrants | Grenada | 0.0 /100 | #320 | Tragic 7.3% |
| Immigrants | Caribbean | 0.0 /100 | #321 | Tragic 7.3% |
| Immigrants | Honduras | 0.0 /100 | #322 | Tragic 7.3% |
| Vietnamese | 0.0 /100 | #323 | Tragic 7.4% |
| Immigrants | Central America | 0.0 /100 | #324 | Tragic 7.4% |
| Immigrants | Cuba | 0.0 /100 | #325 | Tragic 7.5% |
| Immigrants | Bangladesh | 0.0 /100 | #326 | Tragic 7.5% |
| Hispanics or Latinos | 0.0 /100 | #327 | Tragic 7.5% |