Immigrants from Congo vs Lithuanian Married-Couple Family Poverty
COMPARE
Immigrants from Congo
Lithuanian
Married-Couple Family Poverty
Married-Couple Family Poverty Comparison
Immigrants from Congo
Lithuanians
6.1%
MARRIED-COUPLE FAMILY POVERTY
0.2/ 100
METRIC RATING
264th/ 347
METRIC RANK
4.0%
MARRIED-COUPLE FAMILY POVERTY
100.0/ 100
METRIC RATING
11th/ 347
METRIC RANK
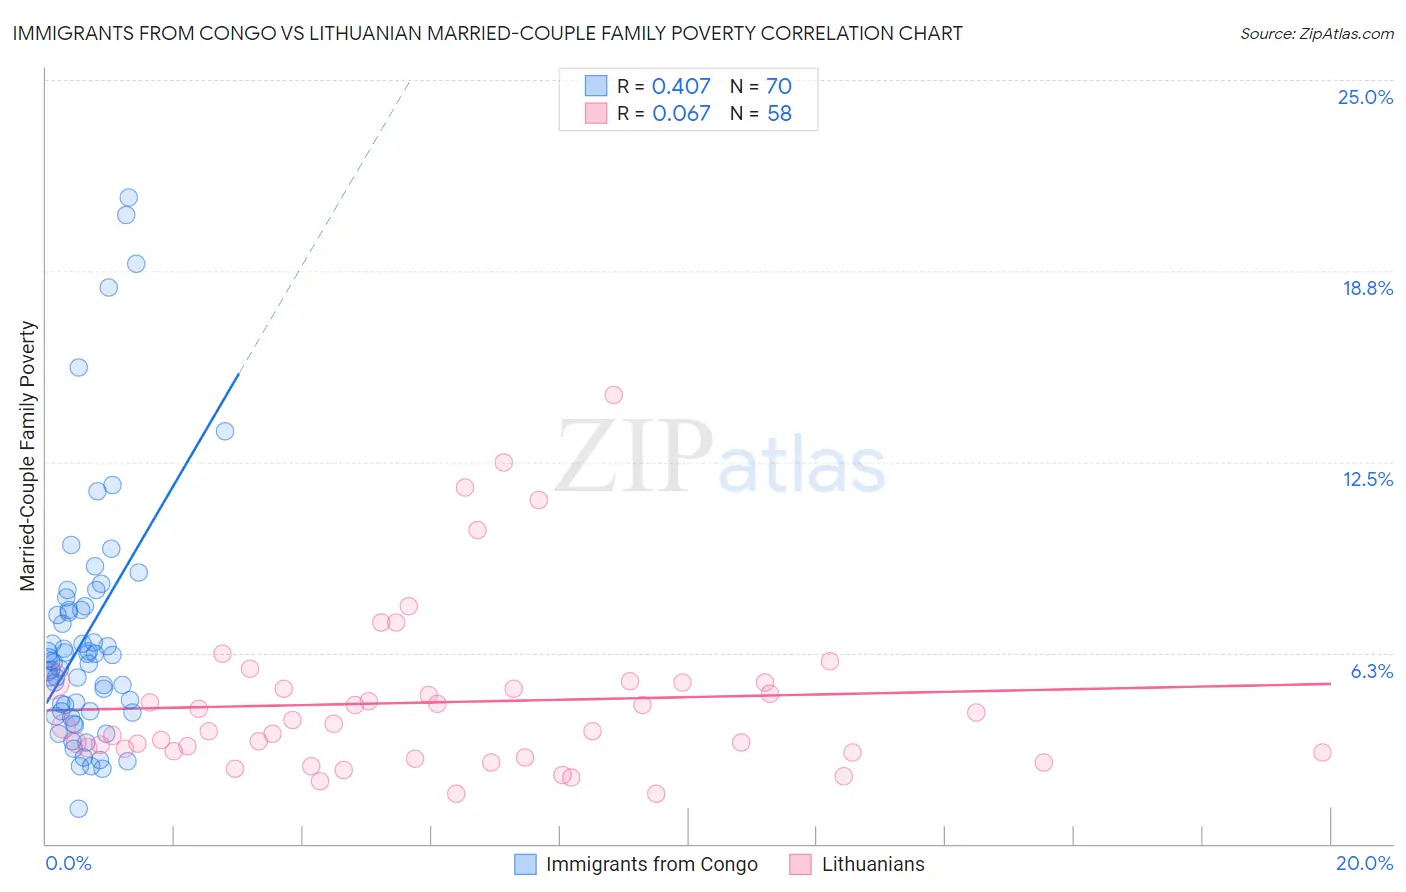
Immigrants from Congo vs Lithuanian Married-Couple Family Poverty Correlation Chart
The statistical analysis conducted on geographies consisting of 91,968,062 people shows a moderate positive correlation between the proportion of Immigrants from Congo and poverty level among married-couple families in the United States with a correlation coefficient (R) of 0.407 and weighted average of 6.1%. Similarly, the statistical analysis conducted on geographies consisting of 416,141,863 people shows a slight positive correlation between the proportion of Lithuanians and poverty level among married-couple families in the United States with a correlation coefficient (R) of 0.067 and weighted average of 4.0%, a difference of 55.1%.
Married-Couple Family Poverty Correlation Summary
| Measurement | Immigrants from Congo | Lithuanian |
| Minimum | 1.1% | 1.6% |
| Maximum | 21.1% | 14.7% |
| Range | 20.0% | 13.1% |
| Mean | 6.8% | 4.6% |
| Median | 6.0% | 3.8% |
| Interquartile 25% (IQ1) | 4.3% | 3.0% |
| Interquartile 75% (IQ3) | 7.7% | 5.3% |
| Interquartile Range (IQR) | 3.3% | 2.3% |
| Standard Deviation (Sample) | 4.1% | 2.7% |
| Standard Deviation (Population) | 4.1% | 2.7% |
Similar Demographics by Married-Couple Family Poverty
Demographics Similar to Immigrants from Congo by Married-Couple Family Poverty
In terms of married-couple family poverty, the demographic groups most similar to Immigrants from Congo are Immigrants from Senegal (6.1%, a difference of 0.22%), Blackfeet (6.2%, a difference of 0.43%), Creek (6.2%, a difference of 0.51%), Spanish American (6.2%, a difference of 0.56%), and Shoshone (6.1%, a difference of 0.62%).
| Demographics | Rating | Rank | Married-Couple Family Poverty |
| Immigrants | Burma/Myanmar | 0.5 /100 | #257 | Tragic 6.0% |
| Immigrants | Immigrants | 0.5 /100 | #258 | Tragic 6.0% |
| Alaskan Athabascans | 0.4 /100 | #259 | Tragic 6.1% |
| Jamaicans | 0.3 /100 | #260 | Tragic 6.1% |
| Senegalese | 0.3 /100 | #261 | Tragic 6.1% |
| Shoshone | 0.3 /100 | #262 | Tragic 6.1% |
| Immigrants | Senegal | 0.3 /100 | #263 | Tragic 6.1% |
| Immigrants | Congo | 0.2 /100 | #264 | Tragic 6.1% |
| Blackfeet | 0.2 /100 | #265 | Tragic 6.2% |
| Creek | 0.2 /100 | #266 | Tragic 6.2% |
| Spanish Americans | 0.2 /100 | #267 | Tragic 6.2% |
| Alaska Natives | 0.2 /100 | #268 | Tragic 6.2% |
| Immigrants | West Indies | 0.1 /100 | #269 | Tragic 6.2% |
| Immigrants | Jamaica | 0.1 /100 | #270 | Tragic 6.2% |
| Immigrants | Bahamas | 0.1 /100 | #271 | Tragic 6.2% |
Demographics Similar to Lithuanians by Married-Couple Family Poverty
In terms of married-couple family poverty, the demographic groups most similar to Lithuanians are Carpatho Rusyn (3.9%, a difference of 0.51%), Croatian (3.9%, a difference of 0.56%), Bulgarian (4.0%, a difference of 0.70%), Thai (3.9%, a difference of 1.0%), and Latvian (3.9%, a difference of 1.5%).
| Demographics | Rating | Rank | Married-Couple Family Poverty |
| Slovenes | 100.0 /100 | #4 | Exceptional 3.8% |
| Swedes | 100.0 /100 | #5 | Exceptional 3.9% |
| Luxembourgers | 100.0 /100 | #6 | Exceptional 3.9% |
| Latvians | 100.0 /100 | #7 | Exceptional 3.9% |
| Thais | 100.0 /100 | #8 | Exceptional 3.9% |
| Croatians | 100.0 /100 | #9 | Exceptional 3.9% |
| Carpatho Rusyns | 100.0 /100 | #10 | Exceptional 3.9% |
| Lithuanians | 100.0 /100 | #11 | Exceptional 4.0% |
| Bulgarians | 100.0 /100 | #12 | Exceptional 4.0% |
| Czechs | 100.0 /100 | #13 | Exceptional 4.0% |
| Slovaks | 100.0 /100 | #14 | Exceptional 4.0% |
| Poles | 100.0 /100 | #15 | Exceptional 4.0% |
| Germans | 100.0 /100 | #16 | Exceptional 4.0% |
| Filipinos | 100.0 /100 | #17 | Exceptional 4.0% |
| Italians | 100.0 /100 | #18 | Exceptional 4.0% |