Immigrants from Micronesia vs Lithuanian Married-Couple Family Poverty
COMPARE
Immigrants from Micronesia
Lithuanian
Married-Couple Family Poverty
Married-Couple Family Poverty Comparison
Immigrants from Micronesia
Lithuanians
5.5%
MARRIED-COUPLE FAMILY POVERTY
14.4/ 100
METRIC RATING
210th/ 347
METRIC RANK
4.0%
MARRIED-COUPLE FAMILY POVERTY
100.0/ 100
METRIC RATING
11th/ 347
METRIC RANK
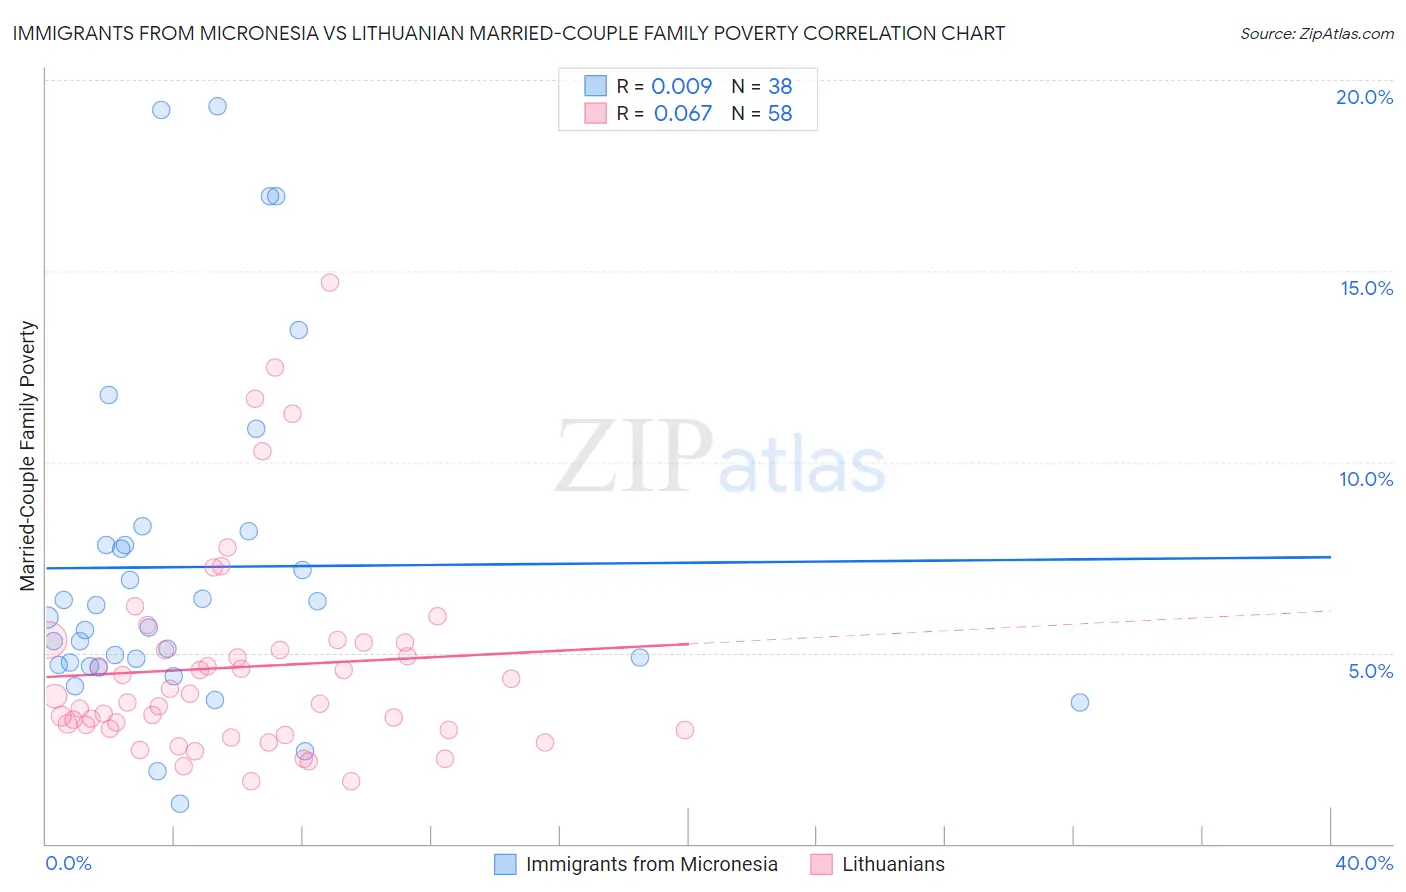
Immigrants from Micronesia vs Lithuanian Married-Couple Family Poverty Correlation Chart
The statistical analysis conducted on geographies consisting of 61,488,987 people shows no correlation between the proportion of Immigrants from Micronesia and poverty level among married-couple families in the United States with a correlation coefficient (R) of 0.009 and weighted average of 5.5%. Similarly, the statistical analysis conducted on geographies consisting of 416,141,863 people shows a slight positive correlation between the proportion of Lithuanians and poverty level among married-couple families in the United States with a correlation coefficient (R) of 0.067 and weighted average of 4.0%, a difference of 38.6%.
Married-Couple Family Poverty Correlation Summary
| Measurement | Immigrants from Micronesia | Lithuanian |
| Minimum | 1.0% | 1.6% |
| Maximum | 19.3% | 14.7% |
| Range | 18.3% | 13.1% |
| Mean | 7.2% | 4.6% |
| Median | 5.8% | 3.8% |
| Interquartile 25% (IQ1) | 4.7% | 3.0% |
| Interquartile 75% (IQ3) | 7.8% | 5.3% |
| Interquartile Range (IQR) | 3.2% | 2.3% |
| Standard Deviation (Sample) | 4.5% | 2.7% |
| Standard Deviation (Population) | 4.4% | 2.7% |
Similar Demographics by Married-Couple Family Poverty
Demographics Similar to Immigrants from Micronesia by Married-Couple Family Poverty
In terms of married-couple family poverty, the demographic groups most similar to Immigrants from Micronesia are Nigerian (5.5%, a difference of 0.020%), Immigrants from Thailand (5.5%, a difference of 0.090%), Immigrants from Syria (5.5%, a difference of 0.21%), Immigrants from Liberia (5.5%, a difference of 0.26%), and Iroquois (5.5%, a difference of 0.31%).
| Demographics | Rating | Rank | Married-Couple Family Poverty |
| Immigrants | Peru | 21.8 /100 | #203 | Fair 5.4% |
| Immigrants | Costa Rica | 19.4 /100 | #204 | Poor 5.4% |
| Chippewa | 18.9 /100 | #205 | Poor 5.4% |
| Osage | 18.4 /100 | #206 | Poor 5.4% |
| Immigrants | Africa | 17.6 /100 | #207 | Poor 5.5% |
| French American Indians | 16.1 /100 | #208 | Poor 5.5% |
| Immigrants | Syria | 15.4 /100 | #209 | Poor 5.5% |
| Immigrants | Micronesia | 14.4 /100 | #210 | Poor 5.5% |
| Nigerians | 14.3 /100 | #211 | Poor 5.5% |
| Immigrants | Thailand | 14.0 /100 | #212 | Poor 5.5% |
| Immigrants | Liberia | 13.3 /100 | #213 | Poor 5.5% |
| Iroquois | 13.1 /100 | #214 | Poor 5.5% |
| Armenians | 12.8 /100 | #215 | Poor 5.5% |
| Potawatomi | 12.4 /100 | #216 | Poor 5.5% |
| Immigrants | Nigeria | 11.3 /100 | #217 | Poor 5.5% |
Demographics Similar to Lithuanians by Married-Couple Family Poverty
In terms of married-couple family poverty, the demographic groups most similar to Lithuanians are Carpatho Rusyn (3.9%, a difference of 0.51%), Croatian (3.9%, a difference of 0.56%), Bulgarian (4.0%, a difference of 0.70%), Thai (3.9%, a difference of 1.0%), and Latvian (3.9%, a difference of 1.5%).
| Demographics | Rating | Rank | Married-Couple Family Poverty |
| Slovenes | 100.0 /100 | #4 | Exceptional 3.8% |
| Swedes | 100.0 /100 | #5 | Exceptional 3.9% |
| Luxembourgers | 100.0 /100 | #6 | Exceptional 3.9% |
| Latvians | 100.0 /100 | #7 | Exceptional 3.9% |
| Thais | 100.0 /100 | #8 | Exceptional 3.9% |
| Croatians | 100.0 /100 | #9 | Exceptional 3.9% |
| Carpatho Rusyns | 100.0 /100 | #10 | Exceptional 3.9% |
| Lithuanians | 100.0 /100 | #11 | Exceptional 4.0% |
| Bulgarians | 100.0 /100 | #12 | Exceptional 4.0% |
| Czechs | 100.0 /100 | #13 | Exceptional 4.0% |
| Slovaks | 100.0 /100 | #14 | Exceptional 4.0% |
| Poles | 100.0 /100 | #15 | Exceptional 4.0% |
| Germans | 100.0 /100 | #16 | Exceptional 4.0% |
| Filipinos | 100.0 /100 | #17 | Exceptional 4.0% |
| Italians | 100.0 /100 | #18 | Exceptional 4.0% |